Exam 2: Organizing and Visualizing Variables
Exam 1: Defining and Collecting Data205 Questions
Exam 2: Organizing and Visualizing Variables212 Questions
Exam 3: Numerical Descriptive Measures163 Questions
Exam 4: Basic Probability171 Questions
Exam 5: Discrete Probability Distributions117 Questions
Exam 6: The Normal Distribution144 Questions
Exam 7: Sampling Distributions127 Questions
Exam 8: Confidence Interval Estimation187 Questions
Exam 9: Fundamentals of Hypothesis Testing: One-Sample Tests177 Questions
Exam 10: Two-Sample Tests300 Questions
Exam 11: Chi-Square Tests128 Questions
Exam 12: Simple Linear Regression204 Questions
Exam 13: Multiple Regression307 Questions
Exam 14: Business Analytics254 Questions
Select questions type
Given below is the scatter plot of the market value (thousands$) and profit (thousands$) of 50 U.S.companies.Higher market values appear to be associated with higher profits. 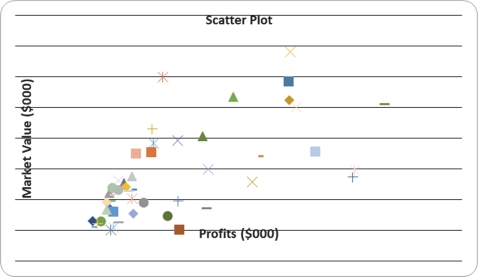
Free
(True/False)
4.8/5  (33)
(33)
Correct Answer: Verified
True
SCENARIO 2-12
The table below contains the opinions of a sample of 200 people broken down by gender about the latest congressional plan to eliminate anti-trust exemptions for professional baseball. For Neutral Against Totals Female 38 54 12 104 Male 12 36 48 96 Totals 50 90 60 200
-Referring to Scenario 2-12, construct a table of total percentages.
Free
(Essay)
4.7/5 (40)
Correct Answer:Verified
SCENARIO 2-8
The Stem-and-Leaf display represents the number of times in a year that a random sample of 100 "lifetime" members of a health club actually visited the facility. Stem Leaves 0 01222223333334445666666667789999 1 1111222234444555669999 2 00011223455556889 3 0000446799 4 011345567 5 0077 6 8 7 67 8 3 9 0247
-Referring to Scenario 2-8, if a frequency distribution with equal sized classes was made from this data, and the first class was "0 but less than 10," the cumulative percentage of the next-to-last class would be .
Free
(Essay)
4.8/5 (37)
Correct Answer:Verified
96% or 0.96 or 96/100
SCENARIO 2-7
The Stem-and-Leaf display below contains data on the number of months between the date a civil suit is filed and when the case is actually adjudicated for 50 cases heard in superior court.Stem Leaves 1 234447899 2 22223455678889 3 0011135778 4 02345579 5 112466 6 158
-Referring to Scenario 2-7, if a frequency distribution with equal sized classes was made from this data, and the first class was "10 but less than 20," the frequency of that class would be .
(Essay)
4.7/5 (32)
SCENARIO 2-10
The relative frequency histogram below represents scores achieved by 200 job applicants on a personality profile. 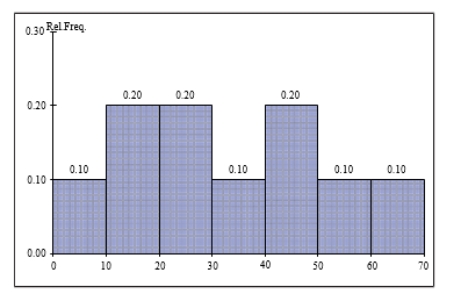 -Referring to the histogram from Scenario 2-10, percent of the job applicants scored below 50.
(Essay)
4.9/5 (33)
SCENARIO 2-8
The Stem-and-Leaf display represents the number of times in a year that a random sample of 100 "lifetime" members of a health club actually visited the facility. Stem Leaves 0 01222223333334445666666667789999 1 1111222234444555669999 2 00011223455556889 3 0000446799 4 011345567 5 0077 6 8 7 67 8 3 9 0247
-Referring to Scenario 2-8, if a frequency distribution with equal sized classes was made from this data, and the first class was "0 but less than 10," the frequency of the fifth class would be_.
(Essay)
4.8/5 (32)
SCENARIO 2-12
The table below contains the opinions of a sample of 200 people broken down by gender about the latest congressional plan to eliminate anti-trust exemptions for professional baseball. For Neutral Against Totals Female 38 54 12 104 Male 12 36 48 96 Totals 50 90 60 200
-Referring to Scenario 2-12, percent of the 200 were males.
(Essay)
4.8/5 (36)
Relationships in a contingency table can be examined more fully if the frequencies are converted into .
(Essay)
4.8/5 (27)
SCENARIO 2-7
The Stem-and-Leaf display below contains data on the number of months between the date a civil suit is filed and when the case is actually adjudicated for 50 cases heard in superior court.Stem Leaves 1 234447899 2 22223455678889 3 0011135778 4 02345579 5 112466 6 158
-Referring to Scenario 2-7, percent of the cases were not adjudicated within the first 4 years.
(Essay)
4.8/5 (35)
SCENARIO 2-12
The table below contains the opinions of a sample of 200 people broken down by gender about the latest congressional plan to eliminate anti-trust exemptions for professional baseball. For Neutral Against Totals Female 38 54 12 104 Male 12 36 48 96 Totals 50 90 60 200
-Referring to Scenario 2-12, of the females in the sample, percent were either neutral or against the plan.
(Essay)
5.0/5 (44)
SCENARIO 2-13
Given below is the stem-and-leaf display representing the amount of detergent used in gallons (with leaves in 10ths of gallons) in a day by 25 drive-through car wash operations in Phoenix. 9\mid147 10\mid02238 11\mid135566777 12\mid223489 13\mid02
-Referring to Scenario 2-13, if a percentage histogram for the detergent data is constructed, using "9.0 but less than 10.0 gallons" as the first class, the percentage of drive-through car wash operations that use "12.0 but less than 13.0 gallons" of detergent would be .
(Essay)
4.9/5 (37)
SCENARIO 2-11
The ordered array below resulted from selecting a sample of 25 batches of 500 computer chips and determining how many in each batch were defective. Defects 1 2 4 4 5 5 6 7 9 9 12 12 15 17 20 21 23 23 25 26 27 27 28 29 29
-Referring to Scenario 2-11, construct a cumulative percentage distribution for the defects data if the corresponding frequency distribution uses "0 but less than 5" as the first class.
(Essay)
4.9/5 (38)
Given below is the scatter plot of the number of employees and the total revenue ($millions) of 20 U.S.companies.There appears to be a positive relationship between total revenue and the number of employees. 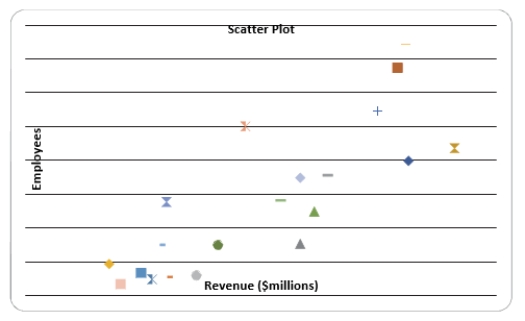
(True/False)
4.8/5 (35)
SCENARIO 2-14
The table below contains the number of people who own a portable Blu-ray player in a sample of 600 broken down by gender. Own a Portable Blu-ray player Male Female Yes 96 40 No 224 240
-Referring to Scenario 2-14, if the sample is a good representation of the population, we can expect percent of the population will own a portable Blu-ray player.
(Essay)
4.9/5 (36)
SCENARIO 2-14
The table below contains the number of people who own a portable Blu-ray player in a sample of 600 broken down by gender. Own a Portable Blu-ray player Male Female Yes 96 40 No 224 240
-Referring to Scenario 2-14, percent of the 600 were females who owned a portableBlu-ray player.
(Essay)
4.9/5 (29)
Apple Computer, Inc.collected information on the age of their customers.Suppose the youngest customer was 12 and the oldest was 72.To study the distribution of the age among its customers, it can use a percentage polygon.
(True/False)
4.8/5 (35)
SCENARIO 2-6
A sample of 200 students at a Big-Ten university was taken after the midterm to ask them whether they went bar hopping the weekend before the midterm or spent the weekend studying, and whether they did well or poorly on the midterm.The following table contains the result. Did Well in Midterm Did Poorly in Midterm Studying for Exam 80 20 Went Bar Hopping 30 70
-Referring to Scenario 2-6, if the sample is a good representation of the population, we can expectpercent of those who spent the weekend studying to do poorly on the midterm.
(Multiple Choice)
4.7/5 (41)
SCENARIO 2-12
The table below contains the opinions of a sample of 200 people broken down by gender about the latest congressional plan to eliminate anti-trust exemptions for professional baseball. For Neutral Against Totals Female 38 54 12 104 Male 12 36 48 96 Totals 50 90 60 200
-Referring to Scenario 2-12, percent of the 200 were females who were against the plan.
(Essay)
4.8/5 (33)
SCENARIO 2-3
Every spring semester, the School of Business coordinates a luncheon with local business leaders for graduating seniors, their families, and friends.Corporate sponsorship pays for the lunches of each of the seniors, but students must purchase tickets to cover the cost of lunches served to guests they bring with them.The following histogram represents the attendance at the senior luncheon, where X is the number of guests each graduating senior invited to the luncheon and f is the number of graduating seniors in each category. 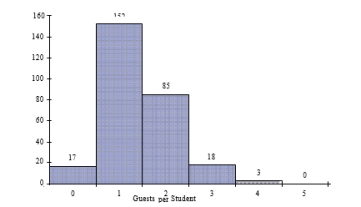 -Referring to the histogram from Scenario 2-3, if all the tickets purchased were used, how many guests attended the luncheon?
(Multiple Choice)
4.9/5 (35)
SCENARIO 2-12
The table below contains the opinions of a sample of 200 people broken down by gender about the latest congressional plan to eliminate anti-trust exemptions for professional baseball. For Neutral Against Totals Female 38 54 12 104 Male 12 36 48 96 Totals 50 90 60 200
-Referring to Scenario 2-12, construct a table of row percentages.
(Essay)
4.8/5 (29)
Filters
- Essay(0)
- Multiple Choice(0)
- Short Answer(0)
- True False(0)
- Matching(0)