Exam 14: Business Analytics
Exam 1: Defining and Collecting Data205 Questions
Exam 2: Organizing and Visualizing Variables212 Questions
Exam 3: Numerical Descriptive Measures163 Questions
Exam 4: Basic Probability171 Questions
Exam 5: Discrete Probability Distributions117 Questions
Exam 6: The Normal Distribution144 Questions
Exam 7: Sampling Distributions127 Questions
Exam 8: Confidence Interval Estimation187 Questions
Exam 9: Fundamentals of Hypothesis Testing: One-Sample Tests177 Questions
Exam 10: Two-Sample Tests300 Questions
Exam 11: Chi-Square Tests128 Questions
Exam 12: Simple Linear Regression204 Questions
Exam 13: Multiple Regression307 Questions
Exam 14: Business Analytics254 Questions
Select questions type
In metric multidimensional scaling, the distance between objects is ratio scaled.
Free
(True/False)
4.7/5  (27)
(27)
Correct Answer: Verified
True
C p >1 indicates that if the process average can be centered, then more than99.73% of the observations will fall inside the specification limits.
Free
(True/False)
5.0/5 (33)
Correct Answer:Verified
True
SCENARIO 15-7
A supplier of silicone sheets for producers of computer chips wants to evaluate her manufacturing process.She takes samples of size 5 from each day's output and counts the number of blemishes on each silicone sheet.The results from 20 days of such evaluations are presented below. sheet Day 1 2 3 4 5 Mean Range 1 8 10 14 6 5 8.6 9 2 8 13 6 6 10 8.6 7 3 10 12 7 7 9 9.0 5 4 5 9 12 7 10 8.6 7 5 8 3 8 9 10 7.6 7 6 9 7 9 6 9 8.0 3 7 10 10 5 7 6 7.6 5 8 10 9 10 6 5 8.0 5 9 6 10 6 9 9 8.0 4 10 6 9 8 6 8 7.4 3 11 8 5 6 10 10 7.8 5 12 6 4 7 7 12 7.2 8 13 7 5 7 6 9 6.8 4 14 5 8 8 7 6 6.8 3 15 7 12 10 6 10 9.0 6 16 7 11 4 7 8 7.4 7 17 8 4 5 4 7 5.6 4 18 11 4 11 11 10 9.4 7 19 6 10 6 10 10 8.4 4 20 6 12 12 6 8 8.8 6 She also decides that the upper specification limit is 10 blemishes.
-Referring to SCENARIO 15-7, an X chart is to be used for the number of blemishes.The lower control limit for this data set is , while the upper control limit is . 
Free
(Essay)
4.8/5 (38)
Correct Answer:Verified
4.785; 11.075
Classification tree is not sensitive to the distribution of the independent variables.
(True/False)
4.8/5 (22)
SCENARIO 15-5
A manufacturer of computer disks took samples of 240 disks on 15 consecutive days.The number of disks with bad sectors was determined for each of these samples.The results are in the table that follows. Day \% 1 9 0.037500 2 7 0.029167 3 4 0.016667 4 6 0.025000 5 8 0.033333 6 3 0.012500 7 6 0.025000 8 10 0.041667 9 16 0.066667 10 24 0.100000 11 15 0.062500 12 9 0.037500 13 4 0.016667 14 8 0.033333 15 6 0.025000
-Referring to SCENARIO 15-5, a p control chart is to be made for these data.The upper control limit is _, and the lower control limit is _.
(Essay)
4.8/5 (30)
SCENARIO 14-2
The treemap below shows the amounts (size) measured in billions of US dollars and percentage changes from prior year (color) of business-to-consumer ecommerce sales last year for North America, Asia Pacific, Western Europe, Central & Eastern Europe, Latin America, and Middle East
& Africa. 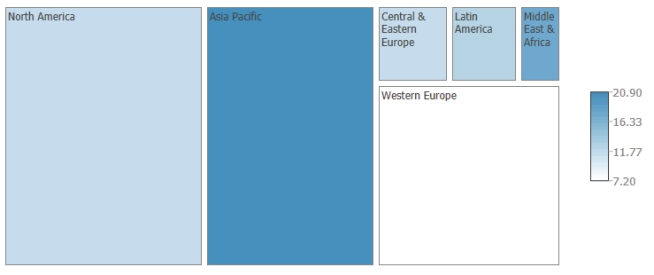 -Referring to SCENARIO 14-2, the North America region has the fastest growth in business-to-consumer ecommerce sales last year.
(True/False)
4.8/5 (35)
The principal focus of the control chart is the attempt to separate special or assignable causes of variation from common causes of variation.Which causes of variation can be reduced only by changing the system?
(Multiple Choice)
4.9/5 (36)
SCENARIO 15-4
A factory supervisor is concerned that the time it takes workers to complete an important production task (measured in seconds) is too erratic and adversely affects expected profits.The supervisor proceeds by randomly sampling 5 individuals per hour for a period of 10 hours.The sample mean and range for each hour are listed below.
 Hour 1 18.4 25 2 16.9 27 3 23.0 30 4 21.2 23 5 21.0 24 6 24.0 25 7 19.3 12 8 15.8 14 9 20.0 13 10 23.0 11 She also decides that lower and upper specification limit for the critical-to-quality variable should be
10 and 30 seconds, respectively.
-Referring to SCENARIO 15-4, suppose the supervisor constructs an X chart to see if the process is in-control.Which expression best describes this chart?
Hour 1 18.4 25 2 16.9 27 3 23.0 30 4 21.2 23 5 21.0 24 6 24.0 25 7 19.3 12 8 15.8 14 9 20.0 13 10 23.0 11 She also decides that lower and upper specification limit for the critical-to-quality variable should be
10 and 30 seconds, respectively.
-Referring to SCENARIO 15-4, suppose the supervisor constructs an X chart to see if the process is in-control.Which expression best describes this chart? 
(Multiple Choice)
4.8/5 (42)
SCENARIO 15-3
A quality control analyst for a light bulb manufacturer is concerned that the time it takes to produce a batch of light bulbs is too erratic.Accordingly, the analyst randomly surveys 10 production periods each day for 14 days and records the sample mean and range for each day.
 Day (inminutes) R 1 58.5 5.1 2 47.6 7.8 3 64.3 6.1 4 60.6 5.7 5 63.7 6.2 6 57.5 6.0 7 55.0 5.4 8 54.9 6.1 9 55.0 5.9 10 62.7 5.0 11 61.9 7.1 12 60.0 6.5 13 58.3 5.9 14 52.0 5.2
-Referring to SCENARIO 15-3, suppose the analyst constructs an X chart to see if the production process is in-control.What is the lower control limit (LCL) for this chart?
Day (inminutes) R 1 58.5 5.1 2 47.6 7.8 3 64.3 6.1 4 60.6 5.7 5 63.7 6.2 6 57.5 6.0 7 55.0 5.4 8 54.9 6.1 9 55.0 5.9 10 62.7 5.0 11 61.9 7.1 12 60.0 6.5 13 58.3 5.9 14 52.0 5.2
-Referring to SCENARIO 15-3, suppose the analyst constructs an X chart to see if the production process is in-control.What is the lower control limit (LCL) for this chart? 
(Multiple Choice)
4.9/5 (28)
SCENARIO 15-1
A local newspaper has 10 delivery boys who each deliver the morning paper to 50 customers every day.The owner decides to record the number of papers delivered on time for a 10-day period for one of the delivery boys and construct a p chart to see whether the percentage is too erratic. Day Number of Papers DeliveredonTime 1 46 2 45 3 46 4 45 5 43 6 48 7 46 8 49 9 48 10 47
-Referring to SCENARIO 15-1, what is the numerical value of the center line for the p chart?
(Multiple Choice)
4.8/5 (45)
SCENARIO 14-3
is a measure of the probability that can
The tree diagram below shows the results of the classification tree model that has been constructed to predict the probability of a cable company's customers who will switch ("Yes" or "No") into its bundled program offering based on the price ($30, $40, $50, $60) and whether the customer spends more than 5 hours a day watching TV ("Yes" or "No") using the data set of 100 customers collected from a survey. 
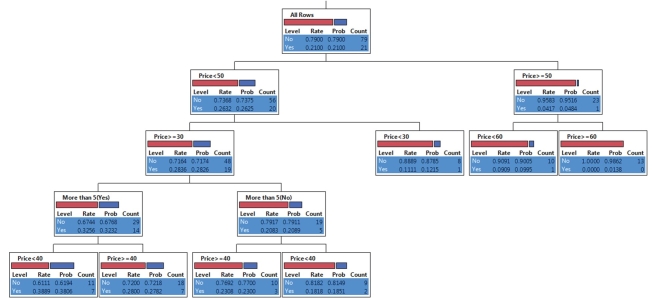 -Referring to SCENARIO 14-3, what is the highest rate of switching into the bundled offering?
(Essay)
4.8/5 (32)
The SS method establishes ways to eliminate unnecessary housekeeping aspects of a work environment.
(True/False)
4.7/5 (34)
SCENARIO 15-4
A factory supervisor is concerned that the time it takes workers to complete an important production task (measured in seconds) is too erratic and adversely affects expected profits.The supervisor proceeds by randomly sampling 5 individuals per hour for a period of 10 hours.The sample mean and range for each hour are listed below.
Hour 1 18.4 25 2 16.9 27 3 23.0 30 4 21.2 23 5 21.0 24 6 24.0 25 7 19.3 12 8 15.8 14 9 20.0 13 10 23.0 11 She also decides that lower and upper specification limit for the critical-to-quality variable should be
10 and 30 seconds, respectively.
-Referring to SCENARIO 15-4, suppose the supervisor constructs an X chart to see if the process is in-control.What is the center line of the chart? 
(Multiple Choice)
4.8/5 (35)
Quick Changeover Techniques is among the tools of Lean Six Sigma.
(True/False)
4.8/5 (35)
Successful implementation of a regression tree requires a method to provide prediction for the target variable at each of the nodes.
(True/False)
4.8/5 (34)
SCENARIO 15-8
Recently, a university switched to a new type of computer-based registration.The registrar is concerned with the amount of time (hours) students are spending on the computer registering under the new system.She decides to randomly select 8 students on each of the 12 days of the registration and determine the time each spends on the computer registering.The range, mean, and standard deviation of the times required to register are in the table that follows. Day Range Mean Std.Dev. 1 10 5.250 3.4949 2 31 15.250 10.3060 3 13 20.375 4.9262 4 21 22.875 8.3911 5 35 8.500 11.3767 6 18 7.875 6.9372 7 25 11.250 8.5815 8 30 7.875 9.5235 9 17 10.250 6.3640 10 22 9.500 7.8740 11 27 7.875 8.7086 12 26 12.875 9.3723
-Referring to SCENARIO 15-8, based on the R chart, it appears that the process is out of control.
(True/False)
4.8/5 (40)
Quick Changeover Techniques establish ways to eliminate unnecessary housekeeping aspects of a work environment.
(True/False)
4.9/5 (36)
SCENARIO 14-3
is a measure of the probability that can
The tree diagram below shows the results of the classification tree model that has been constructed to predict the probability of a cable company's customers who will switch ("Yes" or "No") into its bundled program offering based on the price ($30, $40, $50, $60) and whether the customer spends more than 5 hours a day watching TV ("Yes" or "No") using the data set of 100 customers collected from a survey.
-Referring to SCENARIO 14-3, the highest probability of switching is predicted to occur among customers who watch more than 5 hours of TV a day and are offered the bundled price of higher than $40.
(True/False)
4.9/5 (27)
SCENARIO 15-4
A factory supervisor is concerned that the time it takes workers to complete an important production task (measured in seconds) is too erratic and adversely affects expected profits.The supervisor proceeds by randomly sampling 5 individuals per hour for a period of 10 hours.The sample mean and range for each hour are listed below.
Hour 1 18.4 25 2 16.9 27 3 23.0 30 4 21.2 23 5 21.0 24 6 24.0 25 7 19.3 12 8 15.8 14 9 20.0 13 10 23.0 11 She also decides that lower and upper specification limit for the critical-to-quality variable should be
10 and 30 seconds, respectively.
-Referring to SCENARIO 15-4, suppose the sample mean and range data were based on 6 observations per hour instead of 5.How would this change affect the lower and upper control limits of an R chart?
(Multiple Choice)
5.0/5 (32)
Filters
- Essay(0)
- Multiple Choice(0)
- Short Answer(0)
- True False(0)
- Matching(0)