Exam 14: Performance Measurement
Exam 1: The Purpose and Use of Financial Statements90 Questions
Exam 2: A Further Look at Financial Statements130 Questions
Exam 3: The Accounting Information System96 Questions
Exam 4: Accrual Accounting Concepts87 Questions
Exam 5: Merchandising Operations93 Questions
Exam 6: Reporting and Analyzing Inventory98 Questions
Exam 7: Internal Control and Cash95 Questions
Exam 8: Reporting and Analyzing Receivables70 Questions
Exam 9: Reporting and Analyzing Long-Lived Assets139 Questions
Exam 10: Reporting and Analyzing Liabilities98 Questions
Exam 11: Reporting and Analyzing Shareholders Equity118 Questions
Exam 12: Reporting and Analyzing Investments130 Questions
Exam 13: Statement of Cash Flows75 Questions
Exam 14: Performance Measurement66 Questions
Select questions type
The following items were taken from the financial statements of McGonigal Inc. over a four-year period: 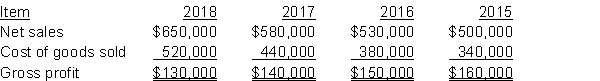 InstructionsUsing horizontal analysis and 2013 as the base year, calculate the horizontal percentages of a base period for net sales, cost of goods sold, and gross profit. Explain whether the trends are favourable or unfavourable for each item.
Free
(Essay)
4.9/5  (47)
(47)
Correct Answer: Verified
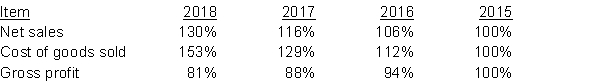 The trend in net sales is increasing and favourable. The cost of goods sold trend is increasing and unfavourable, since it is growing more rapidly than sales. This is resulting in an unfavourable and decreasing trend in gross profit.
A company with $60,000 in current assets and $40,000 in current liabilities pays a $1,000 current liability. As a result of this transaction, the current ratio and working capital will
Free
(Multiple Choice)
4.7/5 (32)
Correct Answer:Verified
C
Use the following information for questions.
Nelly Inc. reported net credit sales of $24,000,000 and cost of goods sold of $18,000,000 for the year. The average inventory for the year was $6,000,000.
-A liquidity ratio measures the
Free
(Multiple Choice)
4.8/5 (30)
Correct Answer:Verified
C
Afrikana Inc. had a balance in the Accounts Receivable account of $820,000 at the beginning of the year and a balance of $880,000 at the end of the year. Net credit sales during the year were $5,920,000. The average collection period of the receivables was
(Multiple Choice)
4.8/5 (27)
Use the following information for questions.
Nelly Inc. reported net credit sales of $24,000,000 and cost of goods sold of $18,000,000 for the year. The average inventory for the year was $6,000,000.
-The days in inventory during the year was
(Multiple Choice)
4.7/5 (38)
Use the following information for questions.
Nelly Inc. reported net credit sales of $24,000,000 and cost of goods sold of $18,000,000 for the year. The average inventory for the year was $6,000,000.
-A supplier to a company would be most interested in the
(Multiple Choice)
4.9/5 (33)
If, over a three-year period, sales increased by 30%, and cost of goods sold increased by 45%,
(Multiple Choice)
4.9/5 (42)
Handles Corp. reported net credit sales of $6,500,000 and cost of goods sold of $3,400,000 for the year. The Accounts Receivable balances at the beginning and end of the year were $525,000 and $575,000, respectively. The receivables turnover ratio was
(Multiple Choice)
4.9/5 (38)
Use the following information for questions. 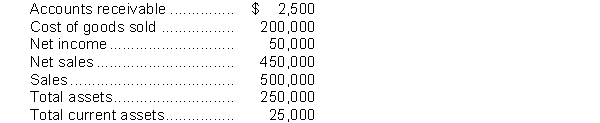 -In performing a vertical analysis, the percentage for accounts receivable is
(Multiple Choice)
4.9/5 (33)
The following items were taken from the financial statements of Nesci Ltd. over a three-year period: 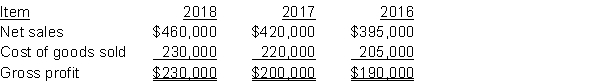 InstructionsUsing horizontal analysis and 2016 as the base year, calculate the horizontal percentages of a base period for net sales, cost of goods sold, and gross profit. Explain whether the trends are favourable or unfavourable for each item.
(Essay)
4.7/5 (29)
In the vertical analysis of a statement of financial position, the base for current liabilities is total liabilities.
(True/False)
4.9/5 (34)
Horizontal analysis is a technique for evaluating financial statement data
(Multiple Choice)
4.8/5 (43)
Comparisons of financial data made within a company are called
(Multiple Choice)
4.8/5 (32)
The receivables turnover and inventory turnover ratios are used to analyze
(Multiple Choice)
4.7/5 (40)
In performing a vertical analysis, the base for prepaid expenses is
(Multiple Choice)
4.8/5 (36)
On a statement of financial position analyzed vertically, total assets are represented by 100%.
(True/False)
4.9/5 (37)
Filters
- Essay(0)
- Multiple Choice(0)
- Short Answer(0)
- True False(0)
- Matching(0)