Exam 14: Performance Measurement
Exam 1: The Purpose and Use of Financial Statements90 Questions
Exam 2: A Further Look at Financial Statements130 Questions
Exam 3: The Accounting Information System96 Questions
Exam 4: Accrual Accounting Concepts87 Questions
Exam 5: Merchandising Operations93 Questions
Exam 6: Reporting and Analyzing Inventory98 Questions
Exam 7: Internal Control and Cash95 Questions
Exam 8: Reporting and Analyzing Receivables70 Questions
Exam 9: Reporting and Analyzing Long-Lived Assets139 Questions
Exam 10: Reporting and Analyzing Liabilities98 Questions
Exam 11: Reporting and Analyzing Shareholders Equity118 Questions
Exam 12: Reporting and Analyzing Investments130 Questions
Exam 13: Statement of Cash Flows75 Questions
Exam 14: Performance Measurement66 Questions
Select questions type
If a company has sales of $100 in 2017 (the base period) and $560 in 2018 (the analysis period), the percentage of the base period is 460%.
(True/False)
4.9/5  (33)
(33)
Assume the following sales data for a company:  What is the percentage increase in sales from 2017 to 2018?
(Multiple Choice)
4.8/5 (41)
In horizontal analysis, if an item has a negative amount in the base year, and a positive amount in the following year, the percentage change will exceed 100%.
(True/False)
4.8/5 (47)
The first step in any comprehensive analysis is to perform a horizontal and vertical analysis.
(True/False)
4.8/5 (40)
Horizontal analysis is a technique for evaluating a series of financial statement data over a period of time
(Multiple Choice)
4.9/5 (27)
Horizontal analysis showed a 25% increase in accounts receivable in 2018 over 2017. Vertical analysis showed accounts receivable declining from 7.5% to 6.8% over the same period. Given this information, what conclusion(s) may be reached?
(Multiple Choice)
4.7/5 (37)
Use the following information for questions.
Nelly Inc. reported net credit sales of $24,000,000 and cost of goods sold of $18,000,000 for the year. The average inventory for the year was $6,000,000.
-Which one of the following would not be considered a liquidity ratio?
(Multiple Choice)
4.7/5 (43)
Comparisons of company data with industry averages provide information about a company's relative position within the industry.
(True/False)
4.9/5 (29)
Using vertical analysis on the income statement, a company's net income as a percentage of net sales is 15%; therefore, the cost of goods sold as a percentage of net sales must be 85%.
(True/False)
5.0/5 (37)
Use the following information for questions.
Nelly Inc. reported net credit sales of $24,000,000 and cost of goods sold of $18,000,000 for the year. The average inventory for the year was $6,000,000.
-Best Baskets Limited (BBL) had a current ratio of 0.8:1 before borrowing $50,000 from the bank with a short-term note payable. What effect did the borrowing transaction have on BBL's current ratio?
(Multiple Choice)
4.9/5 (41)
An assessment of liquidity can be done based on only one ratio, such as the current ratio or the receivables ratio.
(True/False)
4.9/5 (40)
If a company has sales of $220 in 2017 and $560 in 2018, the percentage increase in sales from 2017 to 2018 is 155%.
(True/False)
4.8/5 (40)
Use the following information for questions.
Nelly Inc. reported net credit sales of $24,000,000 and cost of goods sold of $18,000,000 for the year. The average inventory for the year was $6,000,000.
-A weakness of the current ratio is
(Multiple Choice)
5.0/5 (40)
Use the following information for questions. 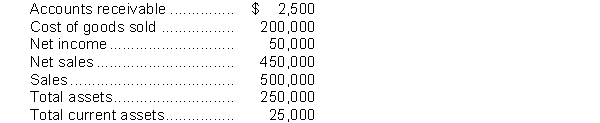 -In performing a vertical analysis, the percentage for cost of goods sold is
(Multiple Choice)
4.7/5 (42)
When preparing a vertical analysis on an income statement, net sales are represented by 100%.
(True/False)
4.8/5 (31)
Filters
- Essay(0)
- Multiple Choice(0)
- Short Answer(0)
- True False(0)
- Matching(0)