Exam 11: Analysis of Variance
Exam 1: Introduction to Statistics36 Questions
Exam 2: Describing, Exploring, and Comparing Data40 Questions
Exam 3: Probability40 Questions
Exam 4: Discrete Probability Distributions38 Questions
Exam 5: Normal Probability Distributions38 Questions
Exam 6: Estimates and Sample Sizes With One Sample29 Questions
Exam 7: Hypothesis Testing With One Sample39 Questions
Exam 8: Inferences From Two Samples31 Questions
Exam 9: Correlation and Regression25 Questions
Exam 10: Multinomial Experiments and Contingency Tables40 Questions
Exam 11: Analysis of Variance40 Questions
Exam 12: Nonparametric Statistics40 Questions
Exam 13: Life Tables40 Questions
Select questions type
Use the following sample data to answer the next questions. Geneticists
studying carriers of genetic diseases followed subjects subdivided by race.
Researchers randomly selected seven patients per race who had been identified as
carrying a certain gene for a genetic disease; these patients were followed to
determine the number of their siblings who also carried the gene for the genetic
disease. Use a One-Way ANOVA at a .05 significance level to test the claim that
the means from the different races are not all the same. 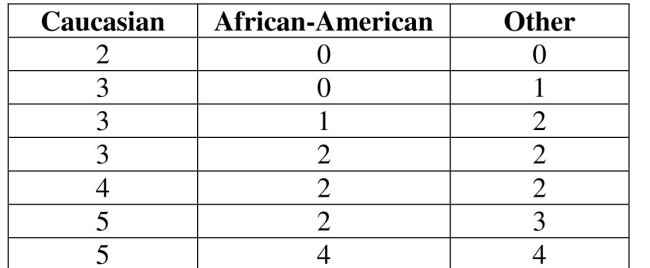 -Determine the value of the F test statistic.
(Short Answer)
4.8/5  (34)
(34)
Use the following technology display from a Two-Way ANOVA to answer the next
questions. Wildlife biologists studying beaver habitats measured the number
of beaver colonies per square mile identified at two randomly selected wetland
habitats, under three densities of tree growth (sparse, average, or dense growth).
Use a .05 significance level. 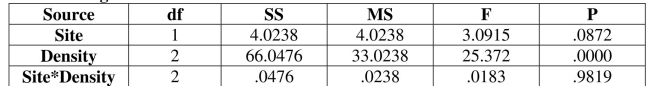 -State a final conclusion about the overall study.
(Essay)
4.9/5 (30)
Determine whether the following statement is true or false.
-Assuming calculations for a One-Way ANOVA with equal sample sizes, if each data value in one of the samples is increased by a fixed amount, then any change in the F test statistic and the P-value is attributable only to the change in the sample variances.
(True/False)
4.8/5 (42)
Use the following sample data to answer the next questions. Geneticists
studying carriers of genetic diseases followed subjects subdivided by race.
Researchers randomly selected seven patients per race who had been identified as
carrying a certain gene for a genetic disease; these patients were followed to
determine the number of their siblings who also carried the gene for the genetic
disease. Use a One-Way ANOVA at a .05 significance level to test the claim that
the means from the different races are not all the same.
-State a conclusion about the null hypothesis.
(Short Answer)
4.8/5 (33)
Use the following technology display from a Two-Way ANOVA to answer the next
questions. Wildlife biologists studying beaver habitats measured the number
of beaver colonies per square mile identified at two randomly selected wetland
habitats, under three densities of tree growth (sparse, average, or dense growth).
Use a .05 significance level.
-For the density effect, identify the null hypothesis, the value of the F test statistic, and the  .
.
(Essay)
4.7/5 (37)
Determine whether the following statement is true or false.
-One method to reduce the effect of extraneous factors is to design the experiment so that it has a convenience sampling design.
(True/False)
4.8/5 (35)
Use the following sample data to answer the next questions. Geneticists
studying carriers of genetic diseases followed subjects subdivided by race.
Researchers randomly selected seven patients per race who had been identified as
carrying a certain gene for a genetic disease; these patients were followed to
determine the number of their siblings who also carried the gene for the genetic
disease. Use a One-Way ANOVA at a .05 significance level to test the claim that
the means from the different races are not all the same.
-Identify the alternative hypothesis.
(Essay)
4.9/5 (37)
Use the following technology display from a Two-Way ANOVA to answer the next
questions. Biologists studying habitat use in Lepidopteran moths measured
the number of savannah moths found at three randomly selected prairie sites with
two potential habitat interferences (expansion of row crops and grazing). Use a .05
significance level. 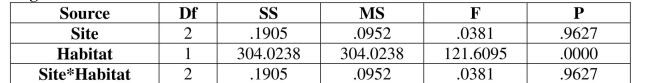 -For the site effect, state a conclusion about the null hypothesis.
(Short Answer)
4.8/5 (41)
Use the following technology display from a Two-Way ANOVA to answer the next
questions. Biologists studying habitat use in Lepidopteran moths measured
the number of savannah moths found at three randomly selected prairie sites with
two potential habitat interferences (expansion of row crops and grazing). Use a .05
significance level.
-For the site effect, identify the null hypothesis, the value of the F test statistic, and the 
(Essay)
4.8/5 (33)
Use the following technology display from a Two-Way ANOVA to answer the next
questions. Wildlife biologists studying beaver habitats measured the number
of beaver colonies per square mile identified at two randomly selected wetland
habitats, under three densities of tree growth (sparse, average, or dense growth).
Use a .05 significance level.
-For the interaction effect, state a conclusion about the null hypothesis.
(Short Answer)
4.9/5 (28)
Use the following technology display from a Two-Way ANOVA to answer the next
questions. Biologists studying habitat use in Lepidopteran moths measured
the number of savannah moths found at three randomly selected prairie sites with
two potential habitat interferences (expansion of row crops and grazing). Use a .05
significance level.
-For the interaction effect, state a conclusion about the null hypothesis.
(Essay)
4.9/5 (38)
Determine whether the following statement is true or false.
-For a Two-Way ANOVA, assuming there is an interaction, we can continue to interpret the results of the row and column effects.
(True/False)
4.8/5 (33)
Use the following sample data to answer the next questions. Geneticists
studying carriers of genetic diseases followed subjects subdivided by race.
Researchers randomly selected seven patients per race who had been identified as
carrying a certain gene for a genetic disease; these patients were followed to
determine the number of their siblings who also carried the gene for the genetic
disease. Use a One-Way ANOVA at a .05 significance level to test the claim that
the means from the different races are not all the same.
-Identify the null hypothesis.
(Short Answer)
4.9/5 (34)
Use the following sample data to answer the next questions. For a study on
Type 1 diabetes, medical graduate students subdivided the United States into four
study regions (Northeast, Southeast, Southwest, and Northwest). The students
randomly selected seven patients per region and recorded the number of times
during a randomly selected month that each patient used insulin shots to regulate
blood sugar levels. Use One-Way ANOVA at a .05 significance level to test the
claim that the means from the different regions are not the same.
Mean number of times patients used insulin shots to regulate blood sugar levels
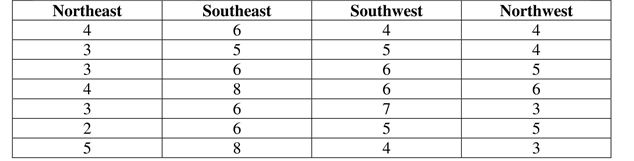 -Identify the alternative hypothesis.
(Essay)
4.8/5 (36)
Determine whether the following statement is true or false.
-If there is only one observation per cell in a Two-Way ANOVA, and it can be assumed there is not an interaction between factors, then we can proceed to interpret the results of the row and column effects.
(True/False)
4.9/5 (39)
Determine whether the following statement is true or false.
-The reason we cannot use two One-Way ANOVAs instead of using a Two-Way ANOVA is that this would ignore the effect of interaction between the two factors.
(True/False)
4.9/5 (35)
Use the following technology display from a Two-Way ANOVA to answer the next
questions. Biologists studying habitat use in Lepidopteran moths measured
the number of savannah moths found at three randomly selected prairie sites with
two potential habitat interferences (expansion of row crops and grazing). Use a .05
significance level.
-For the interaction effect, identify the null hypothesis, the value of the F test statistic, and the 
(Essay)
4.9/5 (26)
Use the following technology display from a Two-Way ANOVA to answer the next
questions. Biologists studying habitat use in Lepidopteran moths measured
the number of savannah moths found at three randomly selected prairie sites with
two potential habitat interferences (expansion of row crops and grazing). Use a .05
significance level.
-For the habitat effect, state a conclusion about the null hypothesis.
(Short Answer)
4.8/5 (29)
Determine whether the following statement is true or false.
-Assuming calculations for a One-Way ANOVA with equal sample sizes, if each data value in one of the samples is increased by a fixed amount, then any change in the F test statistic and the P-value is attributable only to the change in the sample mean.
(True/False)
4.9/5 (39)
Use the following technology display from a Two-Way ANOVA to answer the next
questions. Wildlife biologists studying beaver habitats measured the number
of beaver colonies per square mile identified at two randomly selected wetland
habitats, under three densities of tree growth (sparse, average, or dense growth).
Use a .05 significance level.
-For the site effect, identify the null hypothesis, the value of the F test statistic, and the 
(Essay)
4.8/5 (30)
Filters
- Essay(0)
- Multiple Choice(0)
- Short Answer(0)
- True False(0)
- Matching(0)