Exam 2: Graphical Methods for
Exam 1: Collecting Data in Reasonable Ways44 Questions
Exam 2: Graphical Methods for31 Questions
Exam 3: Numerical Methods for31 Questions
Exam 4: Describing Bivariate Numerical Data29 Questions
Exam 5: Probability29 Questions
Exam 6: Random Variables and18 Questions
Exam 7: Selecting an Appropriate Method4 Questions
Exam 8: Sampling Variability Sampling21 Questions
Exam 9: Estimation Using a Single Sample29 Questions
Exam 10: Asking and Answering Questions About a Population Proportion36 Questions
Exam 11: Asking and Answering Questions About the Difference Between Two Population Proportions16 Questions
Exam 12: Asking and Answering Questions About a Population Mean33 Questions
Exam 13: Asking and Answering Questions About the Difference Between Two Means27 Questions
Exam 14: Learning From Experiment Data8 Questions
Exam 15: Learning From Categorical Data22 Questions
Exam 16: Understanding Relationships Numerical12 Questions
Select questions type
Marine biologists have reported the discovery of a new species of fish in the WesternNorth Atlantic. Data on the head length (n=41) and pelvic fin length (n=30) areshown below. 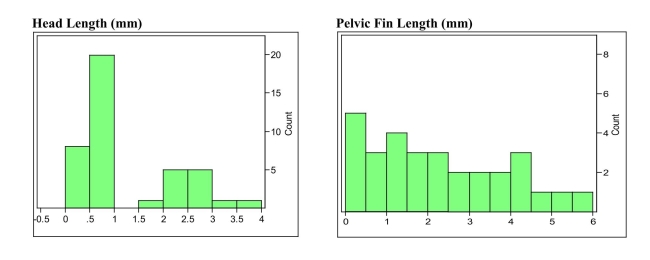 a) Describe the distributions of these two variables using appropriate statisticalterms.
b) The distribution of head lengths appears to be rather strange. What do you thinkmight account for the shape of this distribution?
a) Describe the distributions of these two variables using appropriate statisticalterms.
b) The distribution of head lengths appears to be rather strange. What do you thinkmight account for the shape of this distribution?
(Essay)
4.9/5  (34)
(34)
A numerical variable is continuous if it's possible values correspond toisolated points on the number line.
(True/False)
4.8/5 (41)
Knowledge of where animals forage for food is essential for effective wildlifemanagement and conservation. The data below are foraging heights (in m) for asample of Mountain Chickadees. The data are taken from two different species of firtrees: the Douglas fir and the White fir. 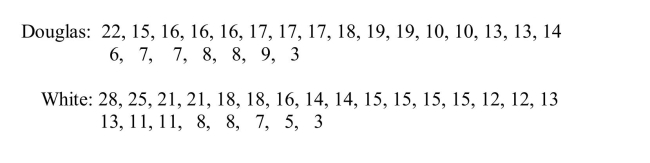 (a) Display these data using a comparative (back-to-back) stem-and-leaf plot. Usethe stems shown below, and be sure to include all information needed to comparethe two distributions.
 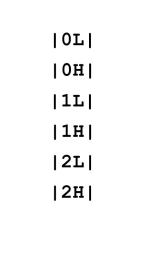 (b) Compare the distributions in part (a). What differences and similarities do youobserve in the two distributions?
(c) When Mountain Chicadees are sampled to assess their health, they are captured inmist-nets, which are set to capture the birds at different heights. The mist nets areabout 2 meters high, and directions must be given to the persons who set up thenests so that the mist-nets are positioned to capture the most birds. Based on thedata from part (a) and your display in part (b), write a short paragraph describingthe appropriate mist-net height in a forest region of Douglas firs and for a forestregion of White firs.
(b) Compare the distributions in part (a). What differences and similarities do youobserve in the two distributions?
(c) When Mountain Chicadees are sampled to assess their health, they are captured inmist-nets, which are set to capture the birds at different heights. The mist nets areabout 2 meters high, and directions must be given to the persons who set up thenests so that the mist-nets are positioned to capture the most birds. Based on thedata from part (a) and your display in part (b), write a short paragraph describingthe appropriate mist-net height in a forest region of Douglas firs and for a forestregion of White firs.
(Essay)
4.8/5 (43)
A time series plot is a graph of data that has been gathered at differentpoints in time.
(True/False)
5.0/5 (43)
The Des Moines Register article in 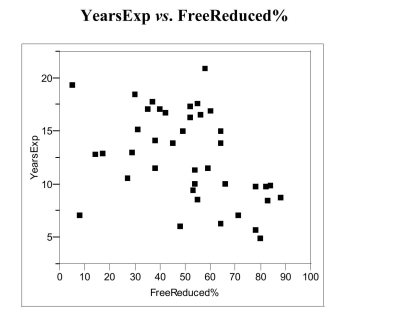 economic status of aneighborhood. The Register wasconcerned that less experiencedteachers typically teach studentsfrom lower-income families. Theaccompanying scatter plot displaysthe data from the article.(a) If lesser experienced teachers typical ly teach students from low-income families,what sort of trend or pattern should appear in the scatter plot?
(b) Does this trend or pattern emerge in these data?
Explain, referring to specificaspects of the scatterplot.
economic status of aneighborhood. The Register wasconcerned that less experiencedteachers typically teach studentsfrom lower-income families. Theaccompanying scatter plot displaysthe data from the article.(a) If lesser experienced teachers typical ly teach students from low-income families,what sort of trend or pattern should appear in the scatter plot?
(b) Does this trend or pattern emerge in these data?
Explain, referring to specificaspects of the scatterplot.
(Essay)
4.8/5 (34)
The Des Moines Register article in YearsExp vs. FreeReduced%problem #2 also related the percentReduced lunch to teacherexperience. The percent ofchildren eligible for Free/Reducedlunch is an indicator of the socioeconomic status of a neighbor-of children eligible for Free and 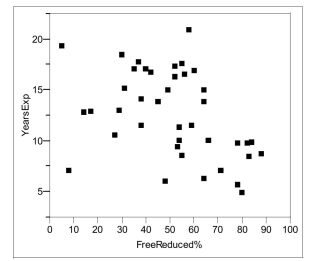 hood. The Register was concernedthat less experienced teacherstypically teach students from lowincome families. Theaccompanying scatter plot displaysthe data from the article.(a) If lesser experienced teachers typical ly teach students from low-income families,what sort of trend or pattern should appear in the scatter plot?
(b) Does this trend or pattern emerge in these data?
Explain, referring to specificaspects of the scatterplot.
hood. The Register was concernedthat less experienced teacherstypically teach students from lowincome families. Theaccompanying scatter plot displaysthe data from the article.(a) If lesser experienced teachers typical ly teach students from low-income families,what sort of trend or pattern should appear in the scatter plot?
(b) Does this trend or pattern emerge in these data?
Explain, referring to specificaspects of the scatterplot.
(Essay)
4.9/5 (31)
In a histogram, class intervals are required to be the same length.
(True/False)
4.7/5 (37)
When using histograms to compare groups of different sizes, one mayuse either frequencies or relative frequencies for the vertical axis and stillbe effective.
(True/False)
4.9/5 (35)
The article "New Rules Would Protect Students" (USA Today, June 16, 2010)reported the percentage of students who received loans to attend college that haddefaulted on the loan within 3 years of when the student was scheduled to beginrepayment of the loan. Information was given for public colleges, private non-profitcolleges, and for-profit colleges. 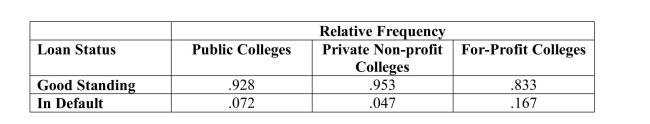 a) Construct a comparative bar chart that would allow you to compare loan status forthe three types of colleges.b) The article states "those who attended for-profit schools were more likely todefault than those who attended public or private non-profit schools." What aspectof the comparative bar chart supports this statement?
(Essay)
4.8/5 (43)
Filters
- Essay(0)
- Multiple Choice(0)
- Short Answer(0)
- True False(0)
- Matching(0)