Exam 3: Quadratic, Piecewise-Defined, and Power Functions
Exam 1: Functions, Graphs, and Models; Linear Functions306 Questions
Exam 2: Linear Models, Equations, and Inequalities212 Questions
Exam 3: Quadratic, Piecewise-Defined, and Power Functions261 Questions
Exam 4: Additional Topics With Functions299 Questions
Exam 5: Exponential and Logarithmic Functions304 Questions
Exam 6: Higher-Degree Polynomial and Rational Functions262 Questions
Exam 7: Systems of Equations and Matrices196 Questions
Exam 8: Special Topics in Algebra265 Questions
Select questions type
The polynomial function represents the yearly income (or loss) from a real estate investment, where t is time in years. After how many years does income begin to decline?
(Multiple Choice)
4.8/5  (39)
(39)
Use the graph of the function to estimate the x-intercepts.
-
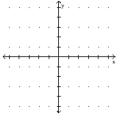
(Multiple Choice)
4.8/5 (42)
Use the graph of the function to estimate the x-intercepts.
-
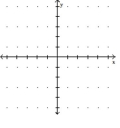
(Multiple Choice)
4.9/5 (36)
Find a power function that models the data in the table. Round to three decimal places if necessary.
-A furniture manufacturer decides to make a new line of desks. The table shows the profit, in thousands of dollars, for various levels of production. Number of Desks Produced 120 350 500 650 750 Profit (Thousands) 13 37 44 34 25 Find a quadratic function to model the data, and use the model to predict the profit if 450 desks are made. Round to the
Nearest thousand.
(Multiple Choice)
4.8/5 (34)
Find a quadratic function that best fits the data. Give answers to the nearest hundredth.
- 2 34 79 110 1024 2345 2267 984
(Multiple Choice)
4.8/5 (38)
The profit for a product is given by x, where x is the number of units produced and sold. Graphically find the x-intercepts of this function to find how many units will give break-even (that is return a
Profit of zero).
(Multiple Choice)
4.9/5 (28)
Determine if the function is increasing or decreasing over the interval indicated.
-
(Multiple Choice)
4.7/5 (40)
Determine if the vertex of the graph is a maximum point or a minimum point.
-
(Multiple Choice)
4.8/5 (36)
Find a power function that models the data in the table. Round to three decimal places if necessary.
-The height of a projectile moving vertically is given by the table, where t is the elapsed time in seconds and h is the height in feet. 0 1 2 3 4 5 100 684 1236 1756 2244 2700
If the height is modeled by , where and are the velocity and height at , respectively, find .
(Multiple Choice)
5.0/5 (32)
Provide an appropriate response.
-Which method of solving the following equation would probably be more convenient?
(Multiple Choice)
4.8/5 (45)
Find a power function that models the data in the table. Round to three decimal places if necessary.
-The height of an object dropped from a tall building is given by the table, where t is the elapsed time in seconds and h is the height in feet. 0 1 2 3 4 5 750 734 686 606 494 350 If the height is modeled by h(t)=-16 , find .
(Multiple Choice)
4.7/5 (37)
Suppose the price p of bolts is related to the quantity q that is demanded by: where q is measured in hundreds of bolts. Suppose the supply function for bolts is given by where q is the number of bolts (in hundreds) that are supplied at price p. Find the equilibrium price.
(Multiple Choice)
4.9/5 (28)
Use a graphing utility to find or approximate solutions to the equation. If necessary, round your answers to three decimal
places.
-
(Multiple Choice)
4.8/5 (39)
Provide an appropriate response.
-If the points in the table lie on a parabola, write the equation whose graph is the parabola. -3 -2 -1 0 -1 -4 -1 8
(Multiple Choice)
4.8/5 (30)
Determine if the graph of the function is concave up or concave down
-
(Multiple Choice)
4.7/5 (40)
Write the equation of the quadratic function whose graph is a parabola containing the given points.
-
(Multiple Choice)
4.8/5 (31)
Filters
- Essay(0)
- Multiple Choice(0)
- Short Answer(0)
- True False(0)
- Matching(0)