Exam 2: Linear Models, Equations, and Inequalities
Exam 1: Functions, Graphs, and Models; Linear Functions306 Questions
Exam 2: Linear Models, Equations, and Inequalities212 Questions
Exam 3: Quadratic, Piecewise-Defined, and Power Functions261 Questions
Exam 4: Additional Topics With Functions299 Questions
Exam 5: Exponential and Logarithmic Functions304 Questions
Exam 6: Higher-Degree Polynomial and Rational Functions262 Questions
Exam 7: Systems of Equations and Matrices196 Questions
Exam 8: Special Topics in Algebra265 Questions
Select questions type
Translate the sentence to an algebraic inequality.
-Assume that the mathematical model represents the cost , in hundreds of dollars, for a certain manufacturer to produce items. How many items can be manufactured while keeping costs between between and ?
Free
(Multiple Choice)
5.0/5  (47)
(47)
Correct Answer: Verified
A
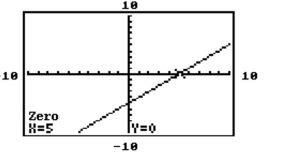
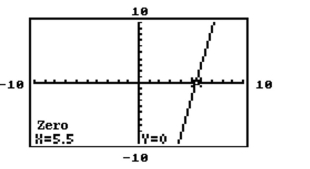
The graph of a certain function and the zero of that function is given. Using this graph, find a) the -intercept of the graph of and b) the solution to the equation .
-
Free
(Multiple Choice)
4.8/5 (31)
Correct Answer:Verified
C
Find the linear function that is the best fit for the given data. Round decimal values to the nearest hundredth, if
necessary.
- 6 8 20 28 36 2 4 13 20 30
(Multiple Choice)
4.7/5 (18)
Solve the system of equations graphically, if a solution exists.
- \[\begin{array} { c }
4 x + y = 6 \\
x + 4 y = 9
(Multiple Choice)
5.0/5 (40)
Translate the sentence to an algebraic inequality.
-Fantastic Flags, Inc. finds that the cost to make flags is , while the revenue produced from them is ( and are in dollars). What is the smallest whole number of flags, , that must be sold for the company to show a profit?
(Multiple Choice)
4.8/5 (29)
Write the best-fit linear model for the data.
-The ages and lengths of several animals of the same species are recorded in the following table: Age (months) Length (inches) 12 9 15 12 17 20 21 21 26 24 28 27 32 35 38 40 41 40 Find and then use a linear model to determine the age of an animal whose length is 30 inches. Round to the nearest year.
(Multiple Choice)
4.9/5 (38)
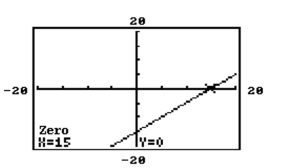
The graph of a certain function and the zero of that function is given. Using this graph, find a) the -intercept of the graph of and b) the solution to the equation .
-
(Multiple Choice)
4.9/5 (37)
Provide an appropriate response.
-A linear model is obtained for the following set of data. 2 4 6 9 10 12 28 33 39 45 47 52 For what range of x-values would it be reasonable to use the model to predict the y-value corresponding to a
given x-value? Why?
(Essay)
5.0/5 (34)
Solve the inequality graphically. Give the solution in interval notation.
-Use the intersection method to solve
(Multiple Choice)
4.8/5 (34)
To find the number of units that gives break-even for the product, solve the equation R ound your answer to the
nearest whole unit.
-Suppose that the total annual consumption of salmon in a certain country is given by and that the total annual consumption of tuna in this country is given by , where consumption is measured in millions of pounds and is the number of years since 2010 . When consumption of salmon reaches consumption of tuna, what is the annual consumption of salmon?
(Multiple Choice)
4.9/5 (38)
Provide an appropriate response.
-A pediatric speech therapist started her own practice in 2004. The table below shows the number of children
she treated each year from 2004 to 2012. The data is to be aligned to the number of years past 2000 and fitted
with a linear model. Year 2004 2005 2006 2007 2008 2009 2010 2011 2012 Number of Patients 11 15 16 20 23 25 29 34 37 Classify each of the following as discrete or continuous.
i) The data in the table
ii) A scatter plot made from the data
iii) The best-fit linear model obtained for the data
iv) The graph of the best-fit linear model obtained for the data
(Essay)
4.8/5 (43)
Provide an appropriate response.
-A pediatric speech therapist started her own practice in 2004. The function y odels the number of patients she treated each year, where x is the number of years after 2004. The model was found using data for
The years between 2004 and 2012. What does the model estimate as the number of patients in 2014? Round to
The nearest whole number. Is this interpolation or extrapolation?
(Multiple Choice)
5.0/5 (35)
The graph of a certain function and the zero of that function is given. Using this graph, find a) the -intercept of the graph of and b) the solution to the equation .
-
(Multiple Choice)
4.7/5 (45)
Without graphing, determine whether the following data set is exactly linear, approximately linear or nonlinear.
- 1 2 3 4 5 9 13 17 21 25
(Multiple Choice)
4.9/5 (39)
Filters
- Essay(0)
- Multiple Choice(0)
- Short Answer(0)
- True False(0)
- Matching(0)