Exam 17: Business Analytics
Exam 1: Defining and Collecting Data200 Questions
Exam 2: Organizing and Visualizing189 Questions
Exam 3: Numerical Descriptive Measures80 Questions
Exam 4: Basic Probability108 Questions
Exam 5: Discrete Probability Distributions81 Questions
Exam 6: Conthe Tinuonormausl Disdis Tributionstribution and Other38 Questions
Exam 7: Sampling Distributions62 Questions
Exam 8: Confidence Interval Estimation139 Questions
Exam 9: Fundamentals of Hypothesis Testing: One-Sample Tests133 Questions
Exam 10: Two-Sample Tests95 Questions
Exam 11: Analysis of Variance73 Questions
Exam 12: Chi-Square and Nonparametric100 Questions
Exam 13: Simple Linear Regression89 Questions
Exam 14: Introduction to Multiple113 Questions
Exam 15: Multiple Regression62 Questions
Exam 16: Time-Series Forecasting61 Questions
Exam 17: Business Analytics102 Questions
Exam 18: A Roadmap for Analyzing Data133 Questions
Exam 19: Statistical Applications in Quality Management86 Questions
Exam 20: Decision Making121 Questions
Select questions type
SCENARIO 17-4
The regression tree below was obtained for predicting the weekend box office revenue of a newly
released movie (in thousands of dollars)based on data collected in different cities on the expenditure
(at $25, $30, $35, $40, $45, $50, $55, $60, $65 or $70 thousand)spent on TV advertising and the
number of times (10, 15, 20, 25, 30 or 35)a day the advertisement appear on TV.
Business Analytics 17-15 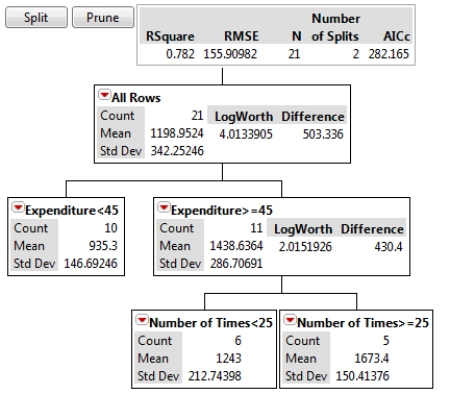 -True or False: Referring to Scenario 17-4, the highest mean weekend box office revenue is
predicted to occur with $55 thousands spent on TV advertisement and 35 advertisement
appearances a day.
-True or False: Referring to Scenario 17-4, the highest mean weekend box office revenue is
predicted to occur with $55 thousands spent on TV advertisement and 35 advertisement
appearances a day.
Free
(True/False)
4.7/5  (30)
(30)
Correct Answer: Verified
False
True or False: In multidimensional scaling, the stress statistic is used to measure the goodness
of fit of the results to the data.
Free
(True/False)
4.9/5 (43)
Correct Answer:Verified
True
SCENARIO 17-4
The regression tree below was obtained for predicting the weekend box office revenue of a newly
released movie (in thousands of dollars)based on data collected in different cities on the expenditure
(at $25, $30, $35, $40, $45, $50, $55, $60, $65 or $70 thousand)spent on TV advertising and the
number of times (10, 15, 20, 25, 30 or 35)a day the advertisement appear on TV.
Business Analytics 17-15
-True or False: Referring to Scenario 17-4, the highest mean weekend box office revenue is
predicted to occur with at least $45 thousand spent on TV advertisement and at least 25
advertisement appearances a day.
Free
(True/False)
4.9/5 (30)
Correct Answer:Verified
True
True or False: Some business analytics involve starting with many variables, followed by filtering
the data by exploring specific combinations of categorical values or numerical range.In Excel, this
approach is mimicked by using gauges.
(True/False)
4.8/5 (31)
True or False: Some business analytics involve starting with many variables, followed by filtering
the data by exploring specific combinations of categorical values or numerical range.
(True/False)
4.8/5 (38)
SCENARIO 17-1 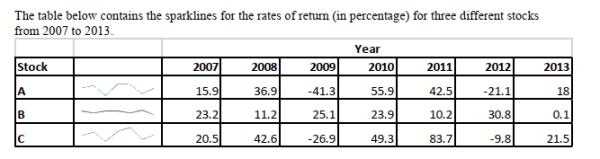 -True or False: Referring to Scenario 17-1, the sparklines enable you to conclude that the rates of
return of the stock market in general is volatile from 2007 to 2013.
-True or False: Referring to Scenario 17-1, the sparklines enable you to conclude that the rates of
return of the stock market in general is volatile from 2007 to 2013.
(True/False)
4.8/5 (43)
SCENARIO 17-3
The tree diagram below shows the results of the classification tree model that has been constructed to
predict the probability of a cable company's customers who will switch ("Yes" or "No")into its
bundled program offering based on the price ($30, $40, $50, $60)and whether the customer spends
more than 5 hours a day watching TV ("Yes" or "No")using the data set of 100 customers collected
from a survey. 
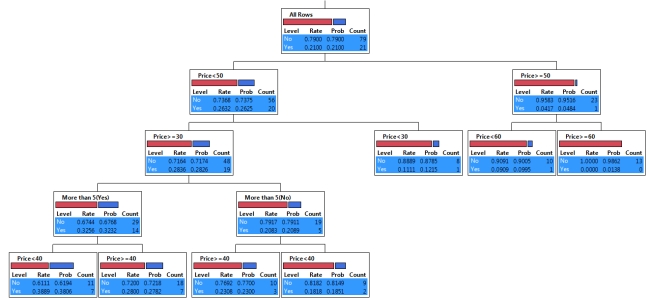 -True or False: Referring to Scenario 17-3, the highest probability of switching is predicted to
occur among customers who watch more than 5 hours of TV a day and are offered the bundled
price of between $30 and $40.
-True or False: Referring to Scenario 17-3, the highest probability of switching is predicted to
occur among customers who watch more than 5 hours of TV a day and are offered the bundled
price of between $30 and $40.
(True/False)
4.8/5 (31)
Which of the following investigates what should occur and suggest the best course of action
For the future?
(Multiple Choice)
4.8/5 (39)
SCENARIO 17-2
The treemap below shows the amounts (size)measured in billions of US dollars and percentage
changes from prior year (color)of business-to-consumer ecommerce sales last year for North
America, Asia Pacific, Western Europe, Central & Eastern Europe, Latin America, and Middle East
& Africa. 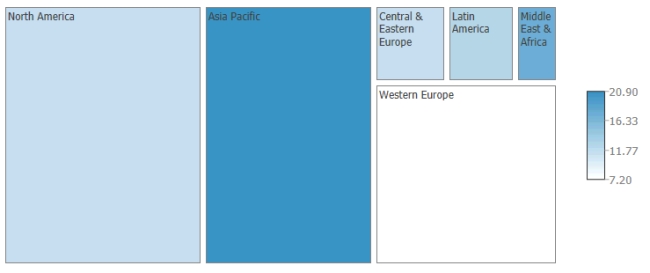 -Referring to Scenario 17-2, which region has the largest amount of business-to-consumer
ecommerce sales last year?
-Referring to Scenario 17-2, which region has the largest amount of business-to-consumer
ecommerce sales last year?
(Essay)
4.8/5 (27)
True or False: In real-world business analytics, filtering is typically performed on large data based
on complex conditional relationships.
(True/False)
4.8/5 (34)
True or False: In k-means clustering, observations that are assigned to a cluster may never be
reassigned to a different cluster later in the process.
(True/False)
5.0/5 (25)
SCENARIO 17-3
The tree diagram below shows the results of the classification tree model that has been constructed to
predict the probability of a cable company's customers who will switch ("Yes" or "No")into its
bundled program offering based on the price ($30, $40, $50, $60)and whether the customer spends
more than 5 hours a day watching TV ("Yes" or "No")using the data set of 100 customers collected
from a survey.
-True or False: Referring to Scenario 17-3, the highest probability of switching is predicted to
occur among customers who watch more than 5 hours of TV a day and are offered the bundled
price of lower than $50.
(True/False)
4.8/5 (41)
SCENARIO 17-4
The regression tree below was obtained for predicting the weekend box office revenue of a newly
released movie (in thousands of dollars)based on data collected in different cities on the expenditure
(at $25, $30, $35, $40, $45, $50, $55, $60, $65 or $70 thousand)spent on TV advertising and the
number of times (10, 15, 20, 25, 30 or 35)a day the advertisement appear on TV.
Business Analytics 17-15
-True or False: Referring to Scenario 17-4, the highest mean weekend box office revenue is
predicted to occur with $55 thousand spent on TV advertisement and at least 25 advertisement
appearances a day.
(True/False)
4.7/5 (27)
True or False: Neural networks require only training data but not validating data.
(True/False)
4.8/5 (34)
Which of the following is NOT among the three broad categories of analytic methods?
(Multiple Choice)
4.9/5 (35)
SCENARIO 17-1
-True or False: Referring to Scenario 17-1, the sparklines enable you to predict that the rates of
return of the stock market in 2014 will be about the same as in 2013.
(True/False)
4.8/5 (29)
SCENARIO 17-2
The treemap below shows the amounts (size)measured in billions of US dollars and percentage
changes from prior year (color)of business-to-consumer ecommerce sales last year for North
America, Asia Pacific, Western Europe, Central & Eastern Europe, Latin America, and Middle East
& Africa.
-Referring to Scenario 17-2, which region has the fastest growth in business-to-consumer
ecommerce sales last year?
(Essay)
4.9/5 (36)
True or False: In nonmetric multidimensional scaling, the distance between objects is ordinal
scaled.
(True/False)
5.0/5 (36)
True or False: There is no significant difference between filtering performed in a complex real-
world business analytic and filtering performed using the slicers in a PivotTable in Excel.
(True/False)
4.8/5 (40)
True or False: Some business analytics involve starting with many variables, followed by filtering
the data by exploring specific combinations of categorical values or numerical range.In Excel, this
approach is mimicked by using a slicer.
(True/False)
5.0/5 (34)
Filters
- Essay(0)
- Multiple Choice(0)
- Short Answer(0)
- True False(0)
- Matching(0)