Exam 19: Statistical Applications in Quality Management
Exam 1: Defining and Collecting Data200 Questions
Exam 2: Organizing and Visualizing189 Questions
Exam 3: Numerical Descriptive Measures80 Questions
Exam 4: Basic Probability108 Questions
Exam 5: Discrete Probability Distributions81 Questions
Exam 6: Conthe Tinuonormausl Disdis Tributionstribution and Other38 Questions
Exam 7: Sampling Distributions62 Questions
Exam 8: Confidence Interval Estimation139 Questions
Exam 9: Fundamentals of Hypothesis Testing: One-Sample Tests133 Questions
Exam 10: Two-Sample Tests95 Questions
Exam 11: Analysis of Variance73 Questions
Exam 12: Chi-Square and Nonparametric100 Questions
Exam 13: Simple Linear Regression89 Questions
Exam 14: Introduction to Multiple113 Questions
Exam 15: Multiple Regression62 Questions
Exam 16: Time-Series Forecasting61 Questions
Exam 17: Business Analytics102 Questions
Exam 18: A Roadmap for Analyzing Data133 Questions
Exam 19: Statistical Applications in Quality Management86 Questions
Exam 20: Decision Making121 Questions
Select questions type
True or False: Referring to Scenario 19-8, based on the  chart, it appears that the process is in
control.
chart, it appears that the process is in
control.
Free
(True/False)
4.8/5  (37)
(37)
Correct Answer: Verified
False
SCENARIO 19-3 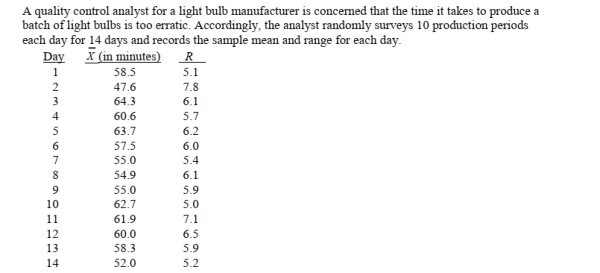 -Referring to Scenario 19-3, suppose the analyst constructs an R chart to see if the variability in
Production times is in-control.The R chart is characterized by which of the following?
-Referring to Scenario 19-3, suppose the analyst constructs an R chart to see if the variability in
Production times is in-control.The R chart is characterized by which of the following?
Free
(Multiple Choice)
4.8/5 (37)
Correct Answer:Verified
C
One of the morals of the red bead experiment is:
Free
(Multiple Choice)
4.8/5 (32)
Correct Answer:Verified
D
True or False: In the United States, the control limits on a control chart are placed so that they are
3 standard deviations above and below a central line.
(True/False)
4.9/5 (41)
True or False: Poke-Yoke devices is among the tools of Lean Six Sigma.
(True/False)
4.9/5 (29)
True or False: The p chart is a control chart used for monitoring the proportion of items that meet
given specifications.
(True/False)
4.8/5 (28)
Which of the following situations suggests a process that appears to be operating in a state of
Statistical control?
(Multiple Choice)
4.9/5 (33)
True or False: One of the morals of the red bead experiment is that variation is part of any
process.
(True/False)
4.8/5 (33)
True or False: The SS method establishes ways to organize necessary housekeeping aspects of a
work environment.
(True/False)
4.9/5 (42)
True or False: Common causes of variation represent variation due to the inherent variability in
the system.
(True/False)
4.8/5 (33)
True or False: Special or assignable causes of variation are signaled by individual fluctuations or
patterns in the data.
(True/False)
4.9/5 (34)
SCENARIO 19-2 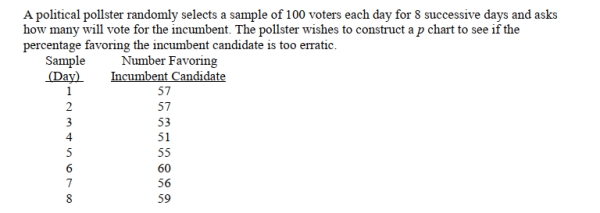 -Referring to Scenario 19-2, what is the numerical value of the center line for the p chart?
(Multiple Choice)
4.9/5 (41)
SCENARIO 19-2
-Referring to Scenario 19-2, what is the numerical value of the lower control limit for the p chart?
(Multiple Choice)
4.9/5 (39)
True or False: SS method focuses on preventing the causes of defects.
(True/False)
4.7/5 (29)
True or False: It is not possible for the  chart to be out-of-control when the R chart is in control.
(True/False)
4.8/5 (34)
Determining the root causes of why defects can occur along with the variables in the processthat cause these defects to occur involves which part of the DMAIC process?
(Multiple Choice)
4.8/5 (28)
SCENARIO 19-3
-Referring to Scenario 19-3, suppose the analyst constructs an R chart to see if the variability in
Production times is in-control.What is the center line of this R chart?
(Multiple Choice)
4.9/5 (37)
True or False: Total Production Maintenance is among the tools of Lean Six Sigma.
(True/False)
4.9/5 (28)
Filters
- Essay(0)
- Multiple Choice(0)
- Short Answer(0)
- True False(0)
- Matching(0)