Exam 18: A Roadmap for Analyzing Data
Exam 1: Defining and Collecting Data200 Questions
Exam 2: Organizing and Visualizing189 Questions
Exam 3: Numerical Descriptive Measures80 Questions
Exam 4: Basic Probability108 Questions
Exam 5: Discrete Probability Distributions81 Questions
Exam 6: Conthe Tinuonormausl Disdis Tributionstribution and Other38 Questions
Exam 7: Sampling Distributions62 Questions
Exam 8: Confidence Interval Estimation139 Questions
Exam 9: Fundamentals of Hypothesis Testing: One-Sample Tests133 Questions
Exam 10: Two-Sample Tests95 Questions
Exam 11: Analysis of Variance73 Questions
Exam 12: Chi-Square and Nonparametric100 Questions
Exam 13: Simple Linear Regression89 Questions
Exam 14: Introduction to Multiple113 Questions
Exam 15: Multiple Regression62 Questions
Exam 16: Time-Series Forecasting61 Questions
Exam 17: Business Analytics102 Questions
Exam 18: A Roadmap for Analyzing Data133 Questions
Exam 19: Statistical Applications in Quality Management86 Questions
Exam 20: Decision Making121 Questions
Select questions type
Four surgical procedures currently are used to install pacemakers.If the patient does not need to
Return for follow-up surgery, the operation is called a "clear" operation.A heart center wants to
Compare the 4 procedures, and collects the following numbers of patients from their own records: 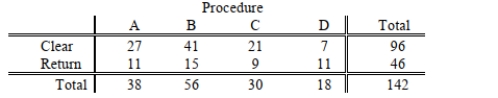 Which of the following tests will be the most appropriate to find out whether the 4 procedures
Are equally effective?
Which of the following tests will be the most appropriate to find out whether the 4 procedures
Are equally effective?
Free
(Multiple Choice)
4.8/5  (32)
(32)
Correct Answer: Verified
A
SCENARIO 18-4
You decide to predict gasoline prices in different cities and towns in the United States for your term
project.Your dependent variable is price of gasoline per gallon and your explanatory variables are
per capita income, the number of firms that manufacture automobile parts in and around the city, the
number of new business starts in the last year, population density of the city, percentage of local
taxes on gasoline, and the number of people using public transportation.You collected data of 32
cities and obtained a regression sum of squares SSR= 122.8821.Your computed value of standard
error of the estimate is 1.9549.
-Referring to Scenario 18-4, if variables that measure the number of new business starts in the
Last year and population density of the city were removed from the multiple regression model,
Which of the following would be true?
Free
(Multiple Choice)
4.8/5 (43)
Correct Answer:Verified
C
SCENARIO 18-1
A real estate builder wishes to determine how house size (House)is influenced by family income
(Income), family size (Size), and education of the head of household (School).House size is
measured in hundreds of square feet, income is measured in thousands of dollars, and education is in
years.The builder randomly selected 50 families and ran the multiple regression.Microsoft Excel
output is provided below: 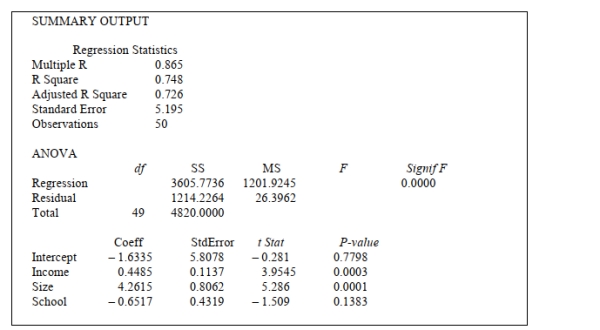 -Referring to Scenario 18-1, one individual in the sample had an annual income of $40,000, a
Family size of 1, and an education of 8 years.This individual owned a home with an area of
1,000 square feet (House = 10.00).What is the residual (in hundreds of square feet)for this data
Point?
-Referring to Scenario 18-1, one individual in the sample had an annual income of $40,000, a
Family size of 1, and an education of 8 years.This individual owned a home with an area of
1,000 square feet (House = 10.00).What is the residual (in hundreds of square feet)for this data
Point?
(Multiple Choice)
4.8/5 (40)
A physician and president of a Tampa Health Maintenance Organization (HMO)are attempting
To show the benefits of managed health care to an insurance company.The physician believes
That certain types of doctors are more cost-effective than others.To investigate this, the president
Obtained independent random samples of 20 HMO physicians from each of 4 primary specialties
- General Practice (GP), Internal Medicine (IM), Pediatrics (PED), and Family Physicians (FP)-
And recorded the total charges per member per month for each.A second variable which the
President believes influences total charges per member per month is whether the doctor is a
Foreign or USA medical school graduate.To investigate this, the president also collected data on
20 foreign medical school graduates in each of the 4 primary specialty types described above.So
Information on charges for 40 doctors (20 foreign and 20 USA medical school graduates)was obtained for each of the 4 specialties.Which of the following tests will be the most appropriate
To find out if the primary specialty and the origin of medical school degree interact to affect the
Charges?
(Multiple Choice)
4.8/5 (30)
SCENARIO 18-4
You decide to predict gasoline prices in different cities and towns in the United States for your term
project.Your dependent variable is price of gasoline per gallon and your explanatory variables are
per capita income, the number of firms that manufacture automobile parts in and around the city, the
number of new business starts in the last year, population density of the city, percentage of local
taxes on gasoline, and the number of people using public transportation.You collected data of 32
cities and obtained a regression sum of squares SSR= 122.8821.Your computed value of standard
error of the estimate is 1.9549.
-Referring to Scenario 18-4, the value of adjusted  is
is
(Multiple Choice)
4.7/5 (41)
The amount of juice that can be squeezed from a randomly selected orange out a box of oranges
With approximately the same size can most likely be modeled by which of the following
Distributions?
(Multiple Choice)
4.8/5 (33)
Suppose the probability of producing a defective light bulb from a production line is the same
Over an interval of 90 minutes.Which of the following distributions would you use to determine
The probability that a defective light bulb will be produced in a 15 minutes interval?
(Multiple Choice)
4.9/5 (45)
SCENARIO 18-1
A real estate builder wishes to determine how house size (House)is influenced by family income
(Income), family size (Size), and education of the head of household (School).House size is
measured in hundreds of square feet, income is measured in thousands of dollars, and education is in
years.The builder randomly selected 50 families and ran the multiple regression.Microsoft Excel
output is provided below:
-Referring to Scenario 18-1, which of the following values for the level of significance is the
Smallest for which at least two explanatory variables are significant individually?
(Multiple Choice)
4.9/5 (30)
SCENARIO 18-1
A real estate builder wishes to determine how house size (House)is influenced by family income
(Income), family size (Size), and education of the head of household (School).House size is
measured in hundreds of square feet, income is measured in thousands of dollars, and education is in
years.The builder randomly selected 50 families and ran the multiple regression.Microsoft Excel
output is provided below:
-
(Multiple Choice)
4.9/5 (29)
Private colleges and universities rely on money contributed by individuals and corporations for
Their operating expenses.Much of this money is put into a fund called an endowment, and the
College spends only the interest earned by the fund.A recent survey of 8 private colleges in the
United States collected information on the endowment amount.Based on this information, which
Of the following will you construct to learn about the mean endowment of all private colleges in
The United States?
(Multiple Choice)
4.8/5 (25)
True or False: Every spring semester, the School of Business coordinates a luncheon for
graduating seniors, their families, and friends with local business leaders .Corporate sponsorship
pays for the lunches of each of the seniors, but students have to purchase tickets to cover the cost
of lunches served to guests they bring with them.Data on the number of guests each graduating
senior invited to the luncheon and the number of graduating seniors in each category were
collected.A histogram can be used to present this information.
(True/False)
4.9/5 (33)
Suppose the probability of finding a defective spot in an area on a piece of glass is the ratio of
That area to the total area of the glass and the probability is the same across the whole glass.
Which of the following distributions would you use to determine the probability of finding a
Defective spot in a randomly selected one square inch area on a piece of 10 feet by 10 feet glass?
(Multiple Choice)
4.9/5 (32)
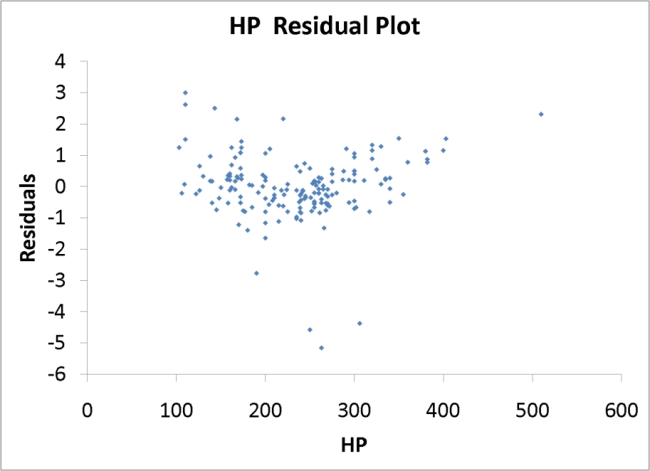
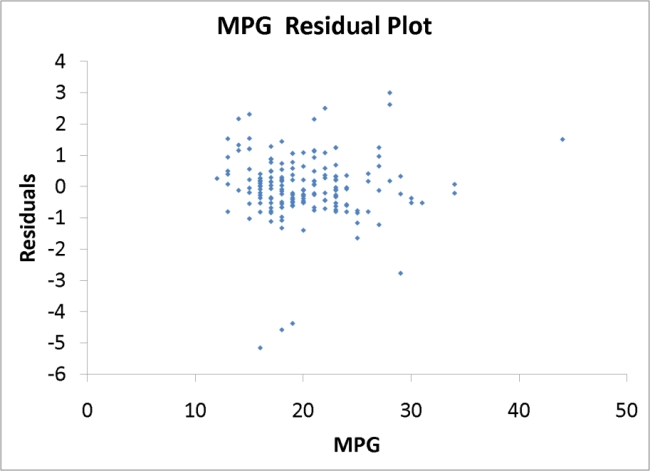
SCENARIO 18-9
What are the factors that determine the acceleration time (in sec.)from 0 to 60 miles per hour of a
car? Data on the following variables for 171 different vehicle models were collected:
Accel Time: Acceleration time in sec.
Cargo Vol: Cargo volume in cu.ft.
HP: Horsepower
MPG: Miles per gallon
SUV: 1 if the vehicle model is an SUV with Coupe as the base when SUV and Sedan are both 0
Sedan: 1 if the vehicle model is a sedan with Coupe as the base when SUV and Sedan are both 0
The regression results using acceleration time as the dependent variable and the remaining variables
as the independent variables are presented below. 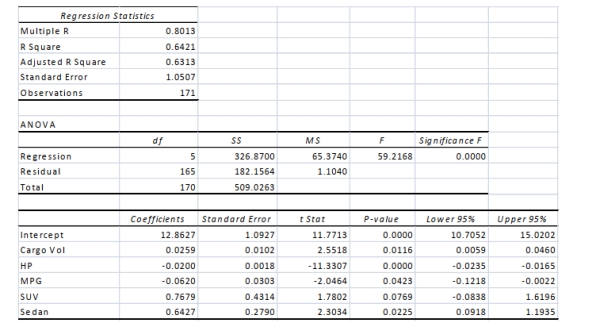 The various residual plots are as shown below.
 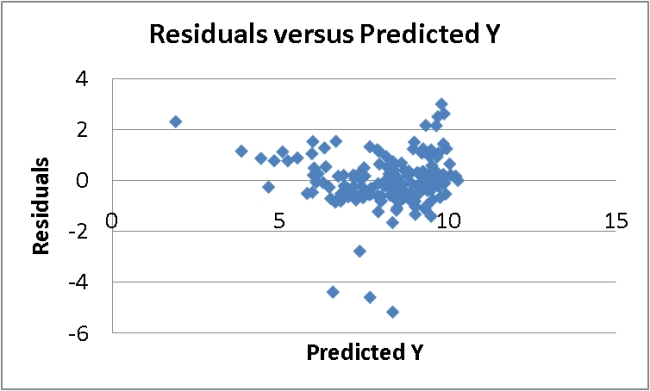 A Roadmap for Analyzing Data 18-63
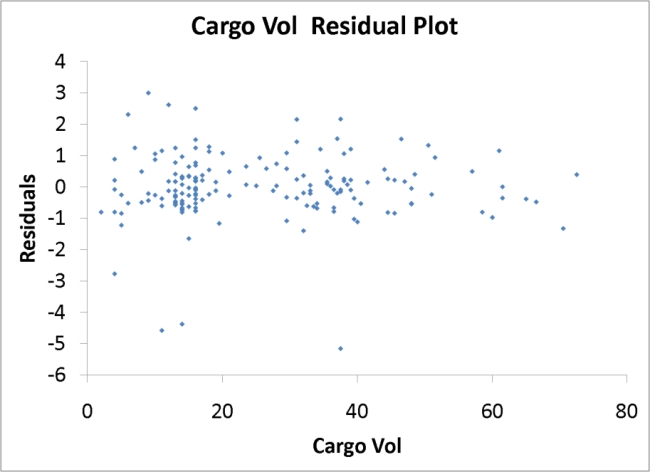
 18-64 A Roadmap for Analyzing Data
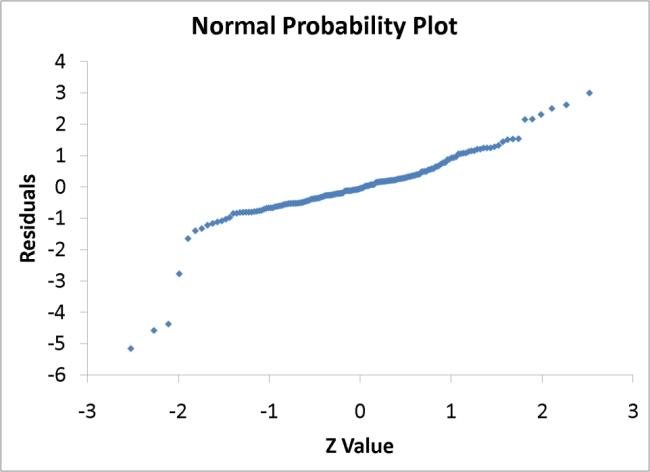
 -True or False: Referring to Scenario 18-9, the 0 to 60 miles per hour acceleration time of a
sedan is predicted to be 0.1252 seconds higher than that of an SUV.
-True or False: Referring to Scenario 18-9, the 0 to 60 miles per hour acceleration time of a
sedan is predicted to be 0.1252 seconds higher than that of an SUV.
(True/False)
4.7/5 (22)
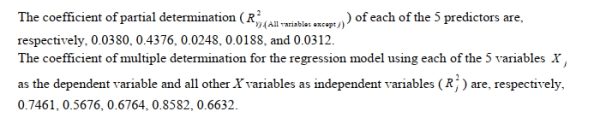
Referring to Scenario 18-10 Model 1, what are the numerator and denominator degrees of
freedom, respectively, for the test statistic to determine whether there is a significant relationship
between the number of weeks a worker is unemployed due to a layoff and the entire set of
explanatory variables?
(Essay)
5.0/5 (37)
Data on the amount of time spent studying and the exam score of 150 students at a high school
Were collected.You want to know if a student's exam score is linearly related to the amount of
Time spent on studying.Which of the following would you compute?
(Multiple Choice)
4.8/5 (40)
A buyer for a manufacturing plant suspects that his primary supplier of raw materials is
Overcharging.In order to determine if his suspicion is correct, he contacts a second supplier and
Asks for the prices on various identical materials.He wants to compare these prices with those of
His primary supplier.He collected data on 6 different materials from both suppliers.He believes
That the differences are normally distributed.Which of the following tests will be the most
Appropriate?
(Multiple Choice)
4.8/5 (28)
It was believed that the probability of a small business that declared bankruptcy per month was
The same in any month.Also the number of small businesses that declared bankruptcy was the
Same every month.Which of the following distributions would you use to determine the
Probability that more than 3 bankruptcies will occur next month?
(Multiple Choice)
4.8/5 (31)
SCENARIO 18-6 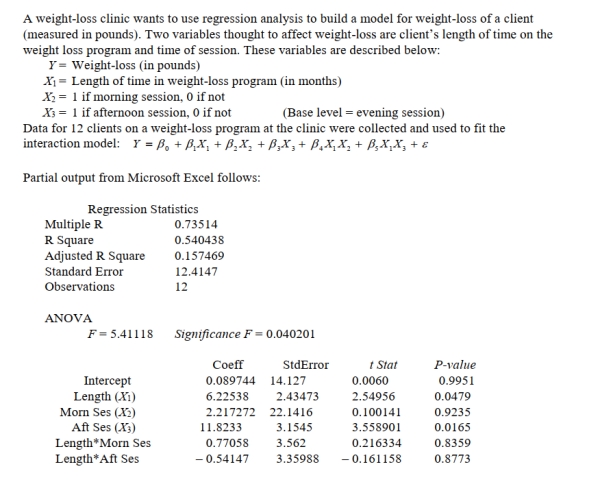 -True or False: Referring to Scenario 18-6, the overall model for predicting weight-loss (Y)is
statistically significant at the 0.05 level.
-True or False: Referring to Scenario 18-6, the overall model for predicting weight-loss (Y)is
statistically significant at the 0.05 level.
(True/False)
4.7/5 (38)
Filters
- Essay(0)
- Multiple Choice(0)
- Short Answer(0)
- True False(0)
- Matching(0)