Exam 2: Functions and Linear Functions
Exam 1: Algebra, Mathematical Models, and Problem Solving181 Questions
Exam 2: Functions and Linear Functions138 Questions
Exam 3: Systems of Linear Equations104 Questions
Exam 4: Inequalities and Problem Solving100 Questions
Exam 5: Polynomials, Polynomial Functions, and Factoring127 Questions
Exam 6: Rational Expressions, Functions, and Equations102 Questions
Exam 7: Radicals, Radical Functions, and Rational Exponents98 Questions
Exam 8: Quadratic Equations and Functions115 Questions
Select questions type
Rewrite the given equation in slope-intercept form by solving for y.
-
(Multiple Choice)
4.9/5  (37)
(37)
Solve the problem.
-A firm is considering a new product. The accounting department estimates that the total cost, C(x), of producing x units will be C(x) = 50x + 9010. The sales department estimates that the revenue, R(x), from selling x units will be R(x) = 60x, but that no more than 488 units can be sold at that price. Find and interpret (R -C)(488).
(Multiple Choice)
5.0/5 (33)
Decide whether the relation is a function.
-{(-3, 5), (1, 2), (6, -4), (8, 3), (10, 7)}
(Multiple Choice)
4.9/5 (36)
Find the domain and range.
-{(-2,-1), (-8,-7), (12,-2), (8,6)}
(Multiple Choice)
4.8/5 (39)
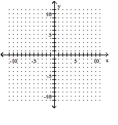
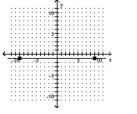
Use the vertical line test to determine whether or not the graph is a graph of a function.
-
(Multiple Choice)
4.9/5 (32)
Find the domain and range.
-{(-4,4), (3,-5), (-6,-3), (-6,-4)}
(Multiple Choice)
4.7/5 (31)
Find the slope of the line that goes through the given points.
-
(Multiple Choice)
4.9/5 (34)
Decide whether the relation is a function.
-{(-8, 9), (-4, 3), (-2, -9), (4, 7)}
(Multiple Choice)
4.7/5 (42)
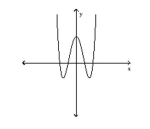
Use the vertical line test to determine whether or not the graph is a graph of a function.
-
(Multiple Choice)
4.7/5 (38)
Decide whether the relation is a function.
-Find g(a - 1) when g(x) = 4x - 4.
(Multiple Choice)
4.9/5 (34)
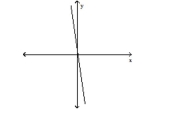
Use the vertical line test to determine whether or not the graph is a graph of a function.
-
(Multiple Choice)
4.8/5 (33)
The graph below shows the percentage of students enrolled in the College of Engineering at State University. Use the graph to answer the question. 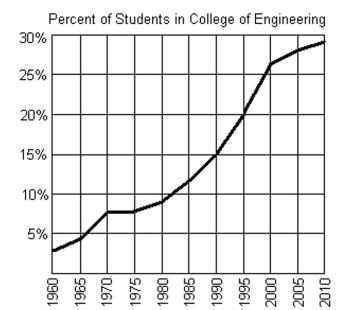 -If f represents the function, find f(2010).
(Multiple Choice)
4.8/5 (36)
The graph below shows the percentage of students enrolled in the College of Engineering at State University. Use the graph to answer the question.
-If f(x) = 20%, what year is represented by x?
(Multiple Choice)
4.8/5 (34)
Find the slope of the line that goes through the given points.
-
(Multiple Choice)
4.7/5 (37)
Filters
- Essay(0)
- Multiple Choice(0)
- Short Answer(0)
- True False(0)
- Matching(0)