Exam 8: Hypothesis Testing for Population Proportions
Exam 1: Introduction to Data60 Questions
Exam 2: Picturing Variation With Graphs59 Questions
Exam 3: Numerical Summaries of Center and Variation59 Questions
Exam 4: Regression Analysis: Exploring Associations Between Variables59 Questions
Exam 5: Modeling Variation With Probability60 Questions
Exam 6: Modeling Random Events: the Normal and Binomial Models40 Questions
Exam 7: Survey Sampling and Inference57 Questions
Exam 8: Hypothesis Testing for Population Proportions57 Questions
Exam 9: Inferring Population Means57 Questions
Exam 10: Associations Between Categorical Variables35 Questions
Exam 11: Multiple Comparisons and Analysis of Variance34 Questions
Exam 12: Experimental Design: Controlling Variation60 Questions
Exam 13: Inference Without Normality25 Questions
Exam 14: Inference for Regression22 Questions
Select questions type
[Objective: Understand the components of hypothesis testing] A quality control manager believes that there are too many defective light bulbs being produced, higher than the advertised rate. The manager's null hypothesis is that the production line of light bulbs has a defect rate of p=0.025 (the light bulb's stated defect rate). He does a hypothesis test with a significance level of 0.05. Symbolically, the null and altemative hypothesis are as follows: ![[Objective: Understand the components of hypothesis testing] A quality control manager believes that there are too many defective light bulbs being produced, higher than the advertised rate. The manager's null hypothesis is that the production line of light bulbs has a defect rate of p=0.025 (the light bulb's stated defect rate). He does a hypothesis test with a significance level of 0.05. Symbolically, the null and altemative hypothesis are as follows: Choose the statement that best describes the significance level in the context of the hypothesis test.](https://storage.examlex.com/TB34225555/11ec8f04_6ae2_2760_aaa3_31c413424014_TB34225555_11.jpg) Choose the statement that best describes the significance level in the context of the hypothesis test.
Choose the statement that best describes the significance level in the context of the hypothesis test.
(Multiple Choice)
5.0/5  (42)
(42)
Use the following information to answer questions (10)- (12). A researcher is wondering whether the smoking habits of young adults (18-25 years of age) in a certain city in the U.S. are the same as the proportion of the general population of young adults in the U.S. A recent study stated that the proportion of young adults who reported smoking at least twice a week or more in the last month was 0.16. The researcher collected data from a random
sample of 75 adults in the city of interest.
-[Objective: Understand the four steos of the hypothesis test] State the hypotheses to be tested for this study.
(Multiple Choice)
4.9/5 (39)
Use the following information to answer questions (10)- (12). A researcher is wondering whether the smoking habits of young adults (18-25 years of age) in a certain city in the U.S. are the same as the proportion of the general population of young adults in the U.S. A recent study stated that the proportion of young adults who reported smoking at least twice a week or more in the last month was 0.16. The researcher collected data from a random
sample of 75 adults in the city of interest.
-Check that the conditions hold so that the sampling distribution of the z-statistic will approximately follow the standard normal distribution. Are the conditions satisfied? If not, choose the condition that is not satisfied.
(Multiple Choice)
4.8/5 (31)
[Objective: Understand the hypothesis test of proportions from two populations] Which of the following is not a condition that must be checked before proceeding with a two-sample test?
(Multiple Choice)
4.9/5 (39)
A researcher wishes to test the claim that the proportion of children with blue eyes in his region is different than one in six, the national rate of blue eyes in children. State and explain the null and alternative hypothesis that should be used to test the claim.
(Essay)
4.8/5 (40)
Which of the following is not one of the four steps of the hypothesis test?
(Multiple Choice)
4.9/5 (40)
[Objective: Understand the p-value] A quality control manager thinks that there is a higher defective rate on the production line than the advertised value of p=0.025. She does a hypothesis test with a significance level of 0.05. Symbolically, the null and alternative hypothesis are as follows: ![[Objective: Understand the p-value] A quality control manager thinks that there is a higher defective rate on the production line than the advertised value of p=0.025. She does a hypothesis test with a significance level of 0.05. Symbolically, the null and alternative hypothesis are as follows: She calculates a p-value for the hypothesis test of defective light bulbs to be approximately 0.067. Choose the correct interpretation for the p-value.](https://storage.examlex.com/TB34225555/11ec8f04_80b2_69b1_aaa3_9b1f19e3d4aa_TB34225555_11.jpg) She calculates a p-value for the hypothesis test of defective light bulbs to be approximately 0.067. Choose the correct interpretation for the p-value.
She calculates a p-value for the hypothesis test of defective light bulbs to be approximately 0.067. Choose the correct interpretation for the p-value.
(Multiple Choice)
4.8/5 (39)
A researcher believes that children who attend elementary school in a rural setting are more physically active then children who attend elementary school in an urban setting. The researcher collects a random sample from each population and records the proportion of children in each sample who reported participating in at least one hour of rigorous activity a day. The data is summarized in the table below. Assume all the conditions for proceeding with a two-sample test have been met.
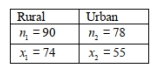 Find the z-statistic (rounded to the nearest hundredth) and p-value (rounded to the nearest thousandth) for this hypothesis test. Using a 5% significance level, state the correct conclusion regarding the null hypothesis:
(Multiple Choice)
4.8/5 (40)
[Objective: Test a hypothesis for a population proportion] A medical researcher conducts a hypothesis test to test the claim that U.S. adult males have gained weight over the past 15 years. Assume that all the conditions for proceeding with a one-sample test on proportions have been met. The calculated test statistic is approximately 1.71 with an associated p-value of approximately 0.0436. Choose the conclusion that provides the best interpretation for the P-value at a significance level of ![[Objective: Test a hypothesis for a population proportion] A medical researcher conducts a hypothesis test to test the claim that U.S. adult males have gained weight over the past 15 years. Assume that all the conditions for proceeding with a one-sample test on proportions have been met. The calculated test statistic is approximately 1.71 with an associated p-value of approximately 0.0436. Choose the conclusion that provides the best interpretation for the P-value at a significance level of](https://storage.examlex.com/TB34225555/11ec8f06_540c_bf54_aaa3_d1ead4832905_TB34225555_11.jpg)
(Multiple Choice)
4.7/5 (44)
[Objective: Understand the hypothesis test of proportions from two populations] Two movie reviewers give movies "thumbs Up" and "thumbs down" ratings. You sample 100 movies that they both have rated and find that they both gave "thumbs up" to 25 movies, both gave "thumbs down" to 30 movies, Sarah gave "thumbs up" and Jessica "thumb down" to 28 movies, and the remaining movies Sarah gave "thumbs down" and Jessica "thumbs up". Test whether there is a tendency for one reviewer to give more movies "thumbs up" (proportion 1) than the other (proportion 2).
(Multiple Choice)
4.8/5 (39)
Use the following information to answer questions (3) - (7). A survey claims that 9 out of 10 doctors recommend
aspirin for their patients with headaches. To test whether the claim is true or not, a random sample of 100 doctors is
obtained. Of these doctors, 82 indicated that they recommend aspirin for headaches. Is the claim accurate? Test with a
significance level of 0.05.
-State and explain the null and alternative hypothesis that should be used to test the claim.
(Essay)
4.7/5 (45)
[Objective: Understand the p-value] From the TI-84 graphing calculator screenshots below, choose the
screenshot whose shaded area correctly depicts the following hypothesis test results:
![[Objective: Understand the p-value] From the TI-84 graphing calculator screenshots below, choose the screenshot whose shaded area correctly depicts the following hypothesis test results:](https://storage.examlex.com/TB34225555/11ec8f05_590c_4ed3_aaa3_271ed3093a45_TB34225555_11.jpg)
(Multiple Choice)
4.9/5 (33)
From the TI-84 graphing calculator screenshots below, there are specific shaded areas that represent p-values. Choose the statement that best describes the interpretation of these p-values. 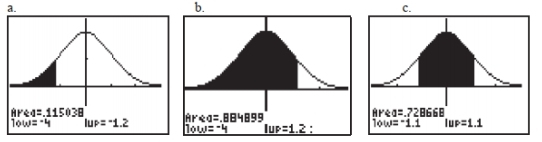
(Multiple Choice)
4.8/5 (36)
[Objective: Interpret the z test statistic] Suppose the janitor tests 300 light bulbs and finds that 33 bulbs are defective. The calculated test statistic is z=1.21. Select the appropriate interpretation of the test statistic.
(Multiple Choice)
4.8/5 (33)
Two different students conduct a coin flipping experiment with a left- tailed alternative. They obtain the following test statistics:  Which of the test statistics has a smaller p-value and why?
(Essay)
4.8/5 (31)
Filters
- Essay(0)
- Multiple Choice(0)
- Short Answer(0)
- True False(0)
- Matching(0)