Exam 4: Regression Analysis: Exploring Associations Between Variables
Exam 1: Introduction to Data60 Questions
Exam 2: Picturing Variation With Graphs59 Questions
Exam 3: Numerical Summaries of Center and Variation59 Questions
Exam 4: Regression Analysis: Exploring Associations Between Variables59 Questions
Exam 5: Modeling Variation With Probability60 Questions
Exam 6: Modeling Random Events: the Normal and Binomial Models40 Questions
Exam 7: Survey Sampling and Inference57 Questions
Exam 8: Hypothesis Testing for Population Proportions57 Questions
Exam 9: Inferring Population Means57 Questions
Exam 10: Associations Between Categorical Variables35 Questions
Exam 11: Multiple Comparisons and Analysis of Variance34 Questions
Exam 12: Experimental Design: Controlling Variation60 Questions
Exam 13: Inference Without Normality25 Questions
Exam 14: Inference for Regression22 Questions
Select questions type
Which scatterplot below depicts a stronger linear relationship? Why? 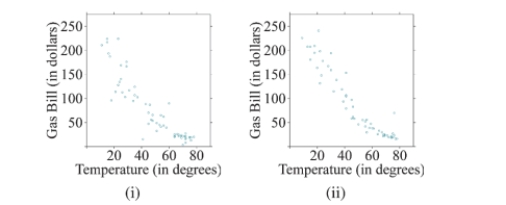
(Multiple Choice)
4.9/5  (34)
(34)
Which scatterplot below depicts a stronger linear relationship? Why? Explain what the scatterplot shows regarding a tree's volume. 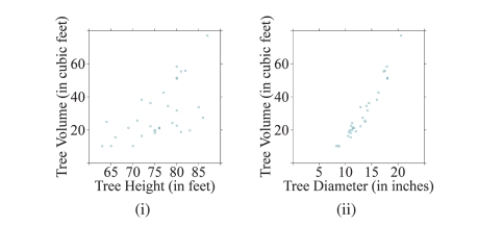
(Essay)
4.7/5 (39)
Use the following information for following questions .
Suppose data were recorded for 100 employees of a large company that included annual salaries
and the number of years the employee has been in their current position. The mean annual salary
was $58,000 with a standard deviation of 12,500. The mean number of years in the current
position is 10 with a standard deviation of 3. The correlation coefficient between the two
variables is approximately 0.93.
-Determine the correct value of the slope for the linear model that predicts annual salary from the number of years in current position and interpret it in context.
(Essay)
4.9/5 (38)
Suppose temperatures and monthly ice cream sales were measured for 100 randomly selected cities. Which variable is the explanatory variable and which one is the response?
(Multiple Choice)
4.9/5 (43)
Which of the following statements regarding the correlation coefficient is true?
(Multiple Choice)
5.0/5 (35)
Use the following information for following questions .
A random sample of 100 cars was taken and data were recorded on the miles per gallon (mpg) in the city
and on the highway. The mean city mpg was 28 with a standard deviation of 9.2. The mean highway mpg
was 35 with a standard deviation of 8.6. The correlation coefficient between city mpg and highway mpg is
-Determine the correct value of the slope for the linear model that predicts highway mpg from city mpg and interpret it in context.
(Multiple Choice)
4.8/5 (37)
Create a data set of 2 variables (X and Y) such that the relationship between X and Y would have a perfect negative correlation of −1.Note: The data set can be very small (three to four X and Y values).
(Essay)
4.9/5 (34)
For the following scatterplot, what effect would the outlier have on the slope of the regression equation? Explain your reasoning. 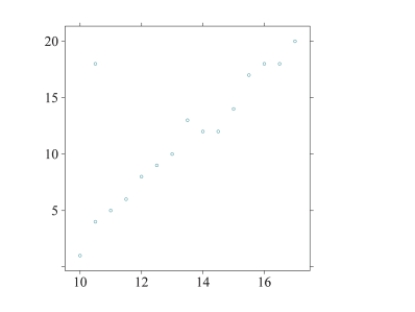
(Essay)
4.8/5 (42)
Given the following scatterplot, if the point in the upper right corner were removed, what will happen to the value of the correlation coefficient, r? 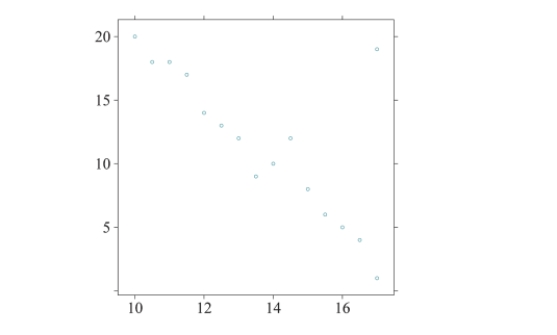
(Multiple Choice)
4.9/5 (40)
Use the following information for following questions .
The following scatterplot shows the relationship between heights (in cm) and weights (in kg) of 100
Americans. The coefficient of determination was found to be 37.9%. 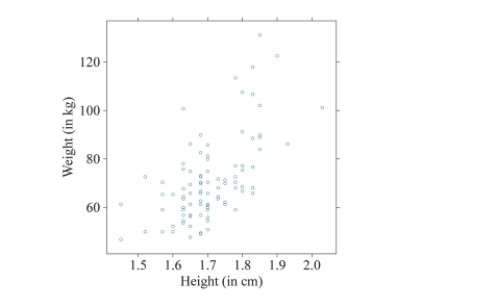 -Calculate the value of the correlation coefficient between height and weight.
(Essay)
4.8/5 (30)
For any set of data, the regression equation will always pass through
(Multiple Choice)
4.8/5 (41)
A study in the Los Angeles Times reported that the number of liquor stores in a neighborhood has a strong positive linear association with the amount of crime in that neighborhood. What can you determine about the relationship between the number of liquor stores and the amount of crime?
(Multiple Choice)
4.9/5 (46)
What effect would an outlier have on the slope of a regression equation?
(Multiple Choice)
4.9/5 (35)
Use the following regression equation regarding airline tickets for following questions .  Note that Distance is the amount of miles between the departure and arrival cities, and Price is the
cost of an airline ticket.
-Interpret the slope of the regression equation in the context of the data.
Note that Distance is the amount of miles between the departure and arrival cities, and Price is the
cost of an airline ticket.
-Interpret the slope of the regression equation in the context of the data.
(Essay)
4.9/5 (30)
Which of the following sets of numbers would result in a positive correlation of 1?
(Multiple Choice)
4.8/5 (35)
Use the following information to answer Questions .
The scatterplot below shows the relationship between the average monthly temperature and the
monthly cost of a gas bill. The correlation coefficient between the values is −0.92. 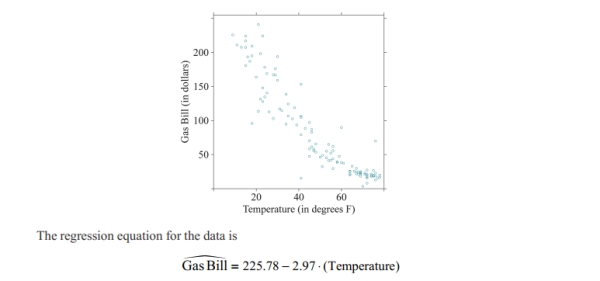 -Do lower monthly temperature cause gas bills to be more expensive? Explain your reasoning.
(Essay)
4.8/5 (38)
A study about exercise routines reported that the amount of time a person spends working out has a strong positive linear association with the amount of weight he/she loses. What can you determine about the relationship between amount of time spent at the gym and the amount of weight a person loses?
(Essay)
4.8/5 (37)
[Objective: Interpret the coefficient of determination in context.] Suppose the correlation coefficient describing how the heights of teenage boys predicts their weights is 0.85. What is the coefficient of determination ![[Objective: Interpret the coefficient of determination in context.] Suppose the correlation coefficient describing how the heights of teenage boys predicts their weights is 0.85. What is the coefficient of determination and what does it mean in context?](https://storage.examlex.com/TB34225555/11ec8f0a_6796_be77_aaa3_e9c3113eb5a7_TB34225555_11.jpg) and what does it mean in context?
and what does it mean in context?
(Multiple Choice)
4.8/5 (29)
Suppose data were collected on neighborhoods about the number of crimes committed and the number of police who patrol the area. Which variable is the explanatory variable and which one is the response? Ex- plain your reasoning.
(Essay)
5.0/5 (37)
Filters
- Essay(0)
- Multiple Choice(0)
- Short Answer(0)
- True False(0)
- Matching(0)