Exam 3: Numerical Summaries of Center and Variation
Exam 1: Introduction to Data60 Questions
Exam 2: Picturing Variation With Graphs59 Questions
Exam 3: Numerical Summaries of Center and Variation59 Questions
Exam 4: Regression Analysis: Exploring Associations Between Variables59 Questions
Exam 5: Modeling Variation With Probability60 Questions
Exam 6: Modeling Random Events: the Normal and Binomial Models40 Questions
Exam 7: Survey Sampling and Inference57 Questions
Exam 8: Hypothesis Testing for Population Proportions57 Questions
Exam 9: Inferring Population Means57 Questions
Exam 10: Associations Between Categorical Variables35 Questions
Exam 11: Multiple Comparisons and Analysis of Variance34 Questions
Exam 12: Experimental Design: Controlling Variation60 Questions
Exam 13: Inference Without Normality25 Questions
Exam 14: Inference for Regression22 Questions
Select questions type
The following boxplot contains information about the length of time (in minutes) it took women
participants to finish the marathon race at the 2012 London Olympics.Use the plot for following questions
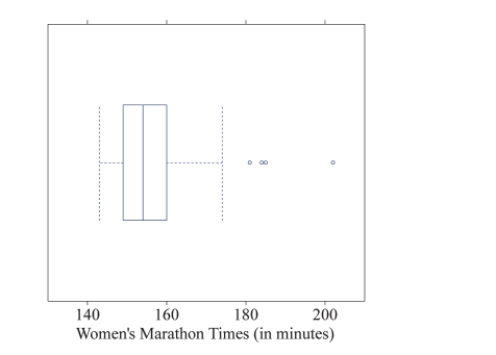 -The fastest 25% of women participants ran the marathon how quickly?
(Multiple Choice)
4.8/5  (42)
(42)
[Be able to calculate the mean for a small set of data.] The heights (in meters) of five adults are listed below. Calculate the mean height of these adults. ![[Be able to calculate the mean for a small set of data.] The heights (in meters) of five adults are listed below. Calculate the mean height of these adults.](https://storage.examlex.com/TB3889/11eb4848_5c00_70e9_bdae_0301ac19b7e8_TB3889_00.jpg)
(Multiple Choice)
4.8/5 (29)
For the pair of histograms below, determine which distribution has the larger standard deviation. 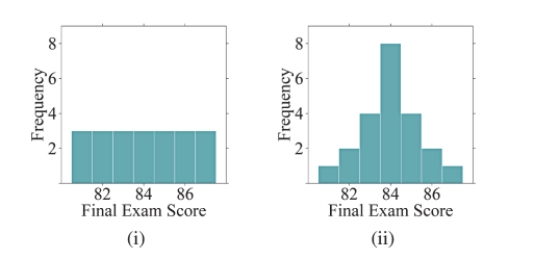
(Multiple Choice)
4.9/5 (27)
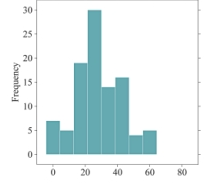
Which boxplot represents the same data as the histogram shown below?
(Multiple Choice)
4.8/5 (31)
Two Geometry classes at North Hollywood High School took the same quiz. Mr. Davis had 15 students in his class with a mean score of 70. Mrs. Brown's class of 25 students had a mean score of 80. Overall, what was the mean score for all students on the quiz?
(Multiple Choice)
4.9/5 (40)
Ten parents were asked the ages of their oldest child. The results are shown below.  What is the IQR for this set of data?
(Multiple Choice)
5.0/5 (41)
The five-number summary of the ages of passengers on a cruise ship is listed below. 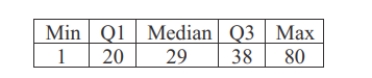 Consider the following two statements regarding outliers for this data and determine which, if any, are correct. (i) There is at least one passenger whose age is a low outlier. (ii) There is at least one passenger whose age is a high outlier.
(Multiple Choice)
4.9/5 (46)
Use the following information for following questions .
The distribution of the number of hours of sleep people get per night is unimodal
and symmetric with a mean of 6 hours and a standard deviation of 1.5 hours.
-If James had a z-score of 1.2, explain what this value means in terms of the number of hours of sleep he gets.
(Multiple Choice)
4.8/5 (37)
Ten parents were asked the ages of their youngest child. The results are shown below.  What is the IQR for this set of data?
(Essay)
4.9/5 (33)
The number of students enrolled in a college algebra class for the last seven semesters are listed below. Find the median. 
(Multiple Choice)
4.8/5 (45)
For a left-skewed distribution, how will the median value compare to the mean value?
(Essay)
4.8/5 (38)
Two Physics classes at Jefferson High School took the same quiz. Mr. Spears had 20 students in his class with a mean score of 80. Mrs. Guyton's class of 30 students had a mean score of 90. Overall, what was the mean score for all students on the quiz?
(Multiple Choice)
4.7/5 (42)
Use the following information for following questions .
The distribution of the number of hours of sleep people get per night is unimodal
and symmetric with a mean of 6 hours and a standard deviation of 1.5 hours.
-Approximately what percent of people sleep between 6 and 7.5 hours per night?
(Multiple Choice)
4.8/5 (39)
The distributions of income in the United States is strongly skewed to the right. Which of the following is true?
(Multiple Choice)
4.9/5 (42)
Suppose we have a data set of the number of car accidents per day in Los Angeles during the year 2013. The data was input into a spreadsheet manually by an assistant at the Department of Transportation. For one day in June 2013, he input that there were 1230 car accidents; but there were actually only 123 that day. How will this error affect the measures of center for this data?
(Multiple Choice)
4.8/5 (42)
Use the following information for following questions
A math professor has two routes he can take to campus. The length of time it takes to drive each
of these routes depends on traffic. Route A has a mean travel time of 20 minutes, with a standard
deviation of 4 minutes. Route B has a mean travel time of 16 minutes, with a standard deviation
of 3 minutes. Assume that both distributions are unimodal and roughly symmetric.
-Explain what a z-score of 1.3 would mean if the professor took Route A.
(Essay)
4.8/5 (34)
The distribution of the number of "friends" all users of a popular social media site have is strongly skewed to the right. Which of the following is true?
(Multiple Choice)
4.8/5 (32)
Use the following information for following questions
A math professor has two routes he can take to campus. The length of time it takes to drive each
of these routes depends on traffic. Route A has a mean travel time of 20 minutes, with a standard
deviation of 4 minutes. Route B has a mean travel time of 16 minutes, with a standard deviation
of 3 minutes. Assume that both distributions are unimodal and roughly symmetric.
-If it took the professor 24 minutes to drive to campus using Route B one day, would you consider this an unusual drive time? Why?
(Essay)
4.8/5 (39)
The mean can be thought of as the balancing point of a distribution. According to this description, at what value is the following distribution balanced? 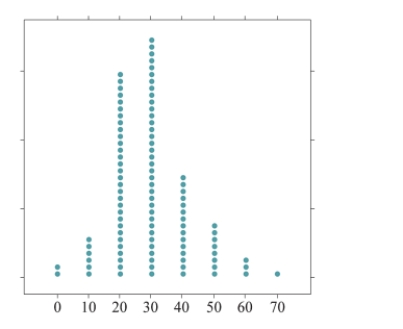
(Multiple Choice)
4.7/5 (30)
For the pair of histograms below, determine which distribution has the smaller standard deviation. 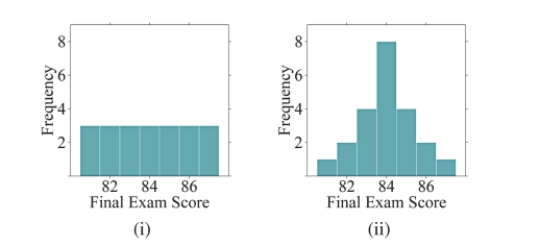
(Multiple Choice)
4.9/5 (37)
Filters
- Essay(0)
- Multiple Choice(0)
- Short Answer(0)
- True False(0)
- Matching(0)