Exam 2: Picturing Variation With Graphs
Exam 1: Introduction to Data60 Questions
Exam 2: Picturing Variation With Graphs59 Questions
Exam 3: Numerical Summaries of Center and Variation59 Questions
Exam 4: Regression Analysis: Exploring Associations Between Variables59 Questions
Exam 5: Modeling Variation With Probability60 Questions
Exam 6: Modeling Random Events: the Normal and Binomial Models40 Questions
Exam 7: Survey Sampling and Inference57 Questions
Exam 8: Hypothesis Testing for Population Proportions57 Questions
Exam 9: Inferring Population Means57 Questions
Exam 10: Associations Between Categorical Variables35 Questions
Exam 11: Multiple Comparisons and Analysis of Variance34 Questions
Exam 12: Experimental Design: Controlling Variation60 Questions
Exam 13: Inference Without Normality25 Questions
Exam 14: Inference for Regression22 Questions
Select questions type
Below are two histograms. One corresponds to the ages at which a sample of people applied for marriage licenses; the other corresponds to the last digit of a sample of social security numbers. Which graph is which, and why? 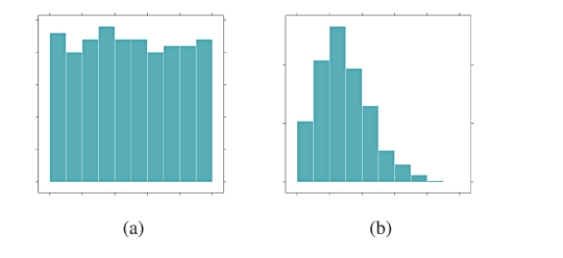
(Essay)
4.8/5  (41)
(41)
According to the word cloud, what is the most common word in the first chapter of Alice's Adventures in Wonderland? Why?
(Multiple Choice)
4.9/5 (34)
In the following histogram, what can you conclude about the bin width? 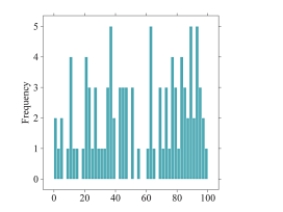
(Multiple Choice)
4.8/5 (40)
What is the difference between a bar chart and a histogram?
(Multiple Choice)
4.9/5 (34)
The bar charts below depict the veteran statuses of Americans, separated by gender. Which bar chart has more variability in veteran status? Why? 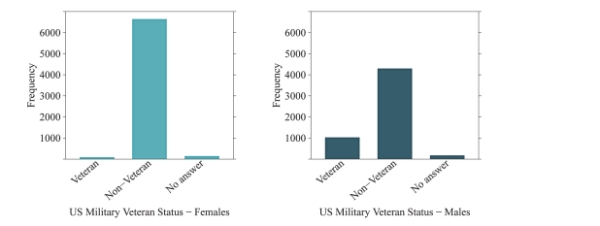
(Multiple Choice)
4.8/5 (26)
for following questions , match one of the histograms below with its appropriate description.
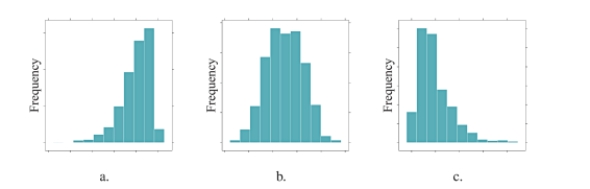 -The distribution of scores on an easy test is displayed in histogram .
(Short Answer)
4.7/5 (33)
Use the following information to answer questions (17) - (18):
A large state university conducted a survey among their students and received 400 responses.
The survey asked the students to provide the following information:
* Age
* Year in School (Freshman, Sophomore, Junior, Senior)
* Major
-What type of graph would you use to describe the variables Major and Year in School?
(Multiple Choice)
4.9/5 (34)
for following questions , what would you expect the shape of the distribution described to look like? Explain your reasoning.
-The distribution of the household incomes in a large city.
(Essay)
4.9/5 (39)
for following questions , match one of the histograms below with its appropriate description.
-The distribution of household income in a large city is displayed in histogram .
(Short Answer)
4.7/5 (28)
Use the word cloud to answer questions
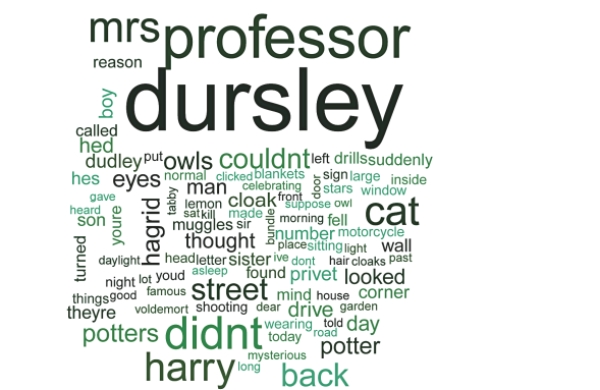 -The words "owls" and "eyes" appear to be similar in size. Does this mean that each of these words is used the same number of times in the first chapter of the book? Why or why not?
(Essay)
4.8/5 (33)
According to the word cloud, which is the most common word in the first chapter of The Fault in Our Stars? Why?
(Multiple Choice)
4.9/5 (38)
How would you describe the typical value for this histogram? Explain your reasoning. 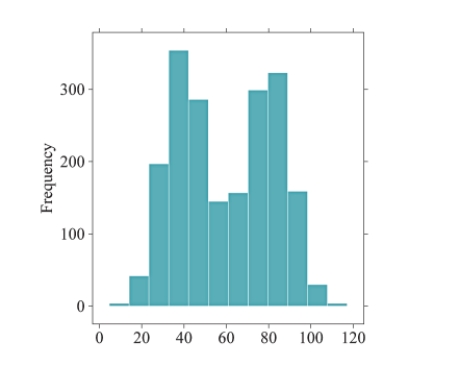
(Essay)
4.9/5 (35)
What information is NOT explicitly portrayed in the word cloud?
(Multiple Choice)
4.9/5 (38)
for following questions , match one of the histograms below with its appropriate description.
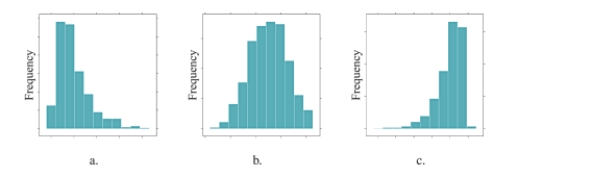 -The distribution of the number of "friends" users of a popular social media site has is displayed in histogram .
(Short Answer)
4.8/5 (33)
How are individual observations recorded in a dotplot versus a stemplot?
(Multiple Choice)
4.9/5 (35)
Which of the following would likely show a bimodal distribution in a histogram?
(Multiple Choice)
5.0/5 (34)
Use the following information to answer questions
A large state university conducted a survey among their students and received 400
responses. The survey asked the students to provide the following information:
* Age
* Year in School (Freshman, Sophomore, Junior, Senior)
* Gender
-What type of graph would you use to describe the variable Year in School? Explain your reasoning.
(Essay)
4.9/5 (32)
Filters
- Essay(0)
- Multiple Choice(0)
- Short Answer(0)
- True False(0)
- Matching(0)