Exam 7: Testing Differences Between Means
Exam 1: Why the Social Researcher Uses Statistics36 Questions
Exam 2: Organizing the Data33 Questions
Exam 3: Measures of Central Tendency37 Questions
Exam 4: Measures of Variability38 Questions
Exam 5: Probability and the Normal Curve43 Questions
Exam 6: Samples and Populations44 Questions
Exam 7: Testing Differences Between Means49 Questions
Exam 8: Analysis of Variance51 Questions
Exam 9: Nonparametric Tests of Significance48 Questions
Exam 10: Correlation47 Questions
Exam 11: Regression Analysis39 Questions
Exam 12: Nonparametric Measures of Correlation41 Questions
Exam 13: Choosing Statistical Procedures for Research Problems39 Questions
Select questions type
The question below refers to the following:
The administration at a university is interested in studying if any relationship exists between satisfaction at the school and whether the student is a freshman or a senior. The school randomly surveys 10 freshmen and 10 seniors and asks them to rate how satisfied they are at the school on a scale of 1-10, where 10 is extremely satisfied and 1 is extremely dissatisfied. Here is the collected data: 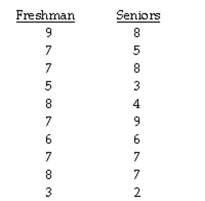 Calculate t.
Free
(Short Answer)
4.8/5  (30)
(30)
Correct Answer: Verified
t = .876
The standard error of the difference between means:
Free
(Multiple Choice)
4.9/5 (42)
Correct Answer:Verified
C
Which of the following does NOT exemplify a research hypothesis:
Free
(Multiple Choice)
4.7/5 (37)
Correct Answer:Verified
C
The question below refers to the following data:
A social researcher wants to test the hypothesis that college students who drink alcohol while text messaging create a different number of keystrokes than those who do not drink while they text. The social researcher studies 50 drinking texters and 50 non-drinking texters. The average number of keystrokes for the drinking texters was 142 with a standard deviation of 7.45. The average number of keystrokes for the non-drinking texters was 134 with a standard deviation of 6.81.
What are your conclusions about the null hypothesis?
(Essay)
4.9/5 (41)
The question below refers to the following data:
A social researcher wants to test the hypothesis that college students who drink alcohol while text messaging create a different number of keystrokes than those who do not drink while they text. The social researcher studies 50 drinking texters and 50 non-drinking texters. The average number of keystrokes for the drinking texters was 142 with a standard deviation of 7.45. The average number of keystrokes for the non-drinking texters
was 134 with a standard deviation of 6.81.
Are your results significant, and if so, at what level?
(Essay)
4.8/5 (41)
The symbols for a Type 1 error and Type 2 error are respectively
(Multiple Choice)
4.9/5 (39)
Democrats and Republicans were surveyed on their support of healthcare reform using a standardized measure (high scores representing greater support of healthcare reform). 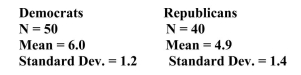 Using the data provided, calculate t.
(Short Answer)
4.9/5 (32)
If our obtained t-value is greater than our critical t-value, we believe that the null hypothesis is __________.
(True/False)
4.8/5 (36)
The null hypothesis in a two-tailed, independent t-test of means would be:
(Multiple Choice)
4.9/5 (37)
English proficiency scores have been collected from 46 students before and after completing an English as a Second Language course. The degrees of freedom for our t-test are __________.
(Short Answer)
4.8/5 (33)
If we reject the null hypothesis when in reality the null hypothesis is true, we have:
(Multiple Choice)
4.8/5 (33)
The question below refers to the following:
The administration at a university is interested in studying if any relationship exists between satisfaction at the school and whether the student is a freshman or a senior. The school randomly surveys 10 freshmen and 10 seniors and asks them to rate how satisfied they are at the school on a scale of 1-10, where 10 is extremely satisfied and 1 is extremely dissatisfied. Here is the collected data: 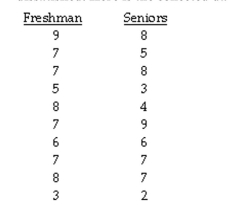 What are the degrees of freedom?
(Short Answer)
4.9/5 (34)
The question below refers to the following data:
A social researcher wants to test the hypothesis that college students who drink alcohol while text messaging create a different number of keystrokes than those who do not drink while they text. The social researcher studies 50 drinking texters and 50 non-drinking texters. The average number of keystrokes for the drinking texters was 142 with a standard deviation of 7.45. The average number of keystrokes for the non-drinking texters was 134
with a standard deviation of 6.81.
What is the research hypothesis? (Pay attention to the scenario.)
(Essay)
4.8/5 (33)
The question below refers to the following data:
A social researcher wants to test the hypothesis that college students who drink alcohol while text messaging create a different number of keystrokes than those who do not drink while they text. The social researcher studies 50 drinking texters and 50 non-drinking texters. The average number of keystrokes for the drinking texters was 142 with a standard deviation of 7.45. The average number of keystrokes for the non-drinking texters was 134
with a standard deviation of 6.81.
Calculate t.
(Short Answer)
4.8/5 (31)
We predetermine our level of _____ for a hypothesis test on the basis of which type of error is more costly.
(Short Answer)
5.0/5 (40)
The t-test can be used for testing the same sample measured twice as well as for two independent samples.
(True/False)
4.8/5 (42)
Compared to the .05 level of significance, the .01 level of significance means:
(Multiple Choice)
4.9/5 (36)
Some researchers contend that anxiety is detrimental to performance, while other researchers contend that anxiety actually enhances performance. To help shed light on this question, Dr. Patterson has her participants work on crossword puzzles both before and after being exposed to an anxiety-inducing stimulus. The scores on an anxiety rating scale from her 4 participants are presented below. 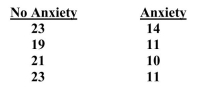 Using α = .05, test the null hypothesis that the two groups do not differ.
(Short Answer)
4.9/5 (41)
Filters
- Essay(0)
- Multiple Choice(0)
- Short Answer(0)
- True False(0)
- Matching(0)