Exam 2: Organizing the Data
Exam 1: Why the Social Researcher Uses Statistics36 Questions
Exam 2: Organizing the Data33 Questions
Exam 3: Measures of Central Tendency37 Questions
Exam 4: Measures of Variability38 Questions
Exam 5: Probability and the Normal Curve43 Questions
Exam 6: Samples and Populations44 Questions
Exam 7: Testing Differences Between Means49 Questions
Exam 8: Analysis of Variance51 Questions
Exam 9: Nonparametric Tests of Significance48 Questions
Exam 10: Correlation47 Questions
Exam 11: Regression Analysis39 Questions
Exam 12: Nonparametric Measures of Correlation41 Questions
Exam 13: Choosing Statistical Procedures for Research Problems39 Questions
Select questions type
A __________ is a table that presents the distribution (frequencies and percents) of one
variable across the categories of one or more additional variables.
Free
(Short Answer)
4.8/5  (40)
(40)
Correct Answer: Verified
cross-tabulation
Work Questions
The question below refers to the following frequency table of quiz scores:
Given the following frequency distribution: 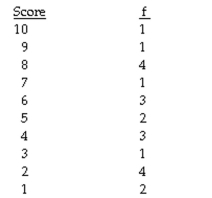 What is the cumulative percentage of score 6?
Free
(Multiple Choice)
4.8/5 (43)
Correct Answer:Verified
D
A __________ is the frequency of occurrence of a category per 100 cases.
(Short Answer)
4.8/5 (42)
__________-level scores can be presented in a grouped frequency distribution to clarify
presentation.
(Short Answer)
4.9/5 (28)
A survey examined the relationship between political party affiliation and gender. The
following cross-tabulation presents the data. 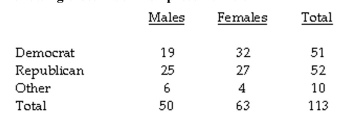 Calculate total percents for each cell.
(Short Answer)
4.7/5 (43)
In a cross tabulation, if the independent variable is on the rows, use __________ percents.
(Multiple Choice)
4.8/5 (37)
The question below refers to the following frequency table of quiz scores:
Given the following frequency distribution: 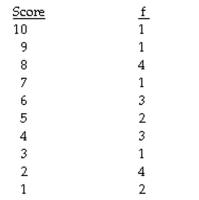 What is the cumulative frequency of score 6?
(Multiple Choice)
4.9/5 (42)
__________ scores on one side of a distribution will cause skewness.
(Short Answer)
4.9/5 (38)
The question below refers to the following frequency table of quiz scores:
Given the following frequency distribution: 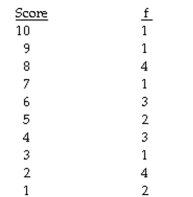 What is the N (total) in the above table?
(Multiple Choice)
4.8/5 (34)
The question below refers to the following list of test scores:
Given the following raw data of test scores:
51, 58, 62, 62, 66, 74, 79, 79, 80, 80, 80, 80, 91, 93, 93, 93
The cumulative percent of a score of 79 is:
(Multiple Choice)
4.9/5 (37)
The question below refers to the following list of test scores:
Given the following raw data of test scores:
51, 58, 62, 62, 66, 74, 79, 79, 80, 80, 80, 80, 91, 93, 93, 93
In the above scenario, having a cumulative percent of 50% for a score of 79 means that:
(Multiple Choice)
4.8/5 (39)
When organizing a frequency table for a variable measured at the nominal level:
(Multiple Choice)
4.8/5 (34)
When organizing a frequency table for a variable measured at the ordinal level:
(Multiple Choice)
4.7/5 (32)
The question below refers to the following list of test scores:
Given the following raw data of test scores:  The cumulative frequency of a score of 74 is:
(Multiple Choice)
4.7/5 (32)
Filters
- Essay(0)
- Multiple Choice(0)
- Short Answer(0)
- True False(0)
- Matching(0)