Exam 6: Samples and Populations
Exam 1: Why the Social Researcher Uses Statistics36 Questions
Exam 2: Organizing the Data33 Questions
Exam 3: Measures of Central Tendency37 Questions
Exam 4: Measures of Variability38 Questions
Exam 5: Probability and the Normal Curve43 Questions
Exam 6: Samples and Populations44 Questions
Exam 7: Testing Differences Between Means49 Questions
Exam 8: Analysis of Variance51 Questions
Exam 9: Nonparametric Tests of Significance48 Questions
Exam 10: Correlation47 Questions
Exam 11: Regression Analysis39 Questions
Exam 12: Nonparametric Measures of Correlation41 Questions
Exam 13: Choosing Statistical Procedures for Research Problems39 Questions
Select questions type
h a standard deviation of .3. 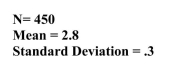 Without using t-scores, calculate the 95% confidence interval.
Free
(Short Answer)
4.8/5  (35)
(35)
Correct Answer: Verified
2.77-2.83
The process of using a table of random numbers:
Free
(Multiple Choice)
4.9/5 (41)
Correct Answer:Verified
B
The question below refers to the following situation:
An education researcher is interested in studying student performance on the SAT. The researcher takes a random sample of 200 students and calculates a sample mean of 1600 and a sample standard deviation of 90.The standard error of the mean is __________.
Free
(Short Answer)
4.8/5 (32)
Correct Answer:Verified
6.36
Through the sampling process, social researchers seek to generalize from a small group to a larger group.
(True/False)
4.9/5 (44)
The question below refers to the following situation:
A researcher interested in school violence investigates the extent to which conflict occurs in schools. She obtains a weekly count of witnessed arguments from 15 students. The data
are as follows: 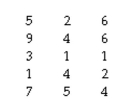 The 99% confidence interval with 14 degrees of freedom is 2.977 according to the t Table.
Therefore, the values of this confidence interval are __________.
The 99% confidence interval with 14 degrees of freedom is 2.977 according to the t Table.
Therefore, the values of this confidence interval are __________.
(Short Answer)
4.8/5 (31)
h a standard deviation of .3. 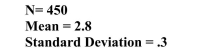 Estimate the standard error of the mean.
(Short Answer)
4.7/5 (41)
The question below refers to the following situation:
A random sample of 500 registered voters in a city shows that 53% of the voters support higher taxes to help fund public schools.
The standard error of the proportion is __________.
(Short Answer)
4.9/5 (32)
The greater the degrees of freedom, the __________ the sample size and the __________ The t distribution approximates the normal distribution.
(Multiple Choice)
4.8/5 (37)
Research that analyzes a portion of an entire population is carried out on a(n):
(Multiple Choice)
4.9/5 (38)
The question below refers to the following situation:
A random sample of 175 people surveyed were asked whether or not they always stop
completely at stop signs. Seventy-five percent responded that they do not.
What is the standard error of the proportion?
(Short Answer)
4.7/5 (37)
The question below refers to the following situation:
An education researcher is interested in studying student performance on the SAT. The researcher takes a random sample of 200 students and calculates a sample mean of 1600 and a sample standard deviation of 90. 
(Short Answer)
4.8/5 (39)
Researchers deal with an extra amount of uncertainty in estimating the standard error of The mean with this distribution:
(Multiple Choice)
4.9/5 (35)
When estimating a population mean, the degrees of freedom, df, is:
(Multiple Choice)
4.9/5 (40)
The question below refers to the following situation:
A random sample of 500 registered voters in a city shows that 53% of the voters support higher taxes to help fund public schools.
Estimate the population proportion with a 95% confidence interval.
(Short Answer)
4.8/5 (36)
The question below refers to the following situation:
An education researcher is interested in studying student performance on the SAT. The researcher takes a random sample of 200 students and calculates a sample mean of 1600 and a sample standard deviation of 90. 
(Short Answer)
4.8/5 (41)
The question below refers to the following situation:
A researcher interested in school violence investigates the extent to which conflict occurs in schools. She obtains a weekly count of witnessed arguments from 15 students. The data are as follows: 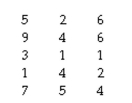 The unbiased estimate of the standard error of the mean is __________.
(Short Answer)
4.9/5 (38)
The question below refers to the following data: 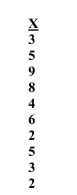 Estimate the standard error of the mean.
(Short Answer)
4.8/5 (34)
Filters
- Essay(0)
- Multiple Choice(0)
- Short Answer(0)
- True False(0)
- Matching(0)