Exam 7: Organizing Data for Effective Analysis
Exam 1: Applying Fundamental Excel Skills and Tools in Problem Solving150 Questions
Exam 2: Solving Problems with Statistical Analysis Tools150 Questions
Exam 3: Determining Effective Data Display with Charts150 Questions
Exam 4: Applying Logic in Decision Making150 Questions
Exam 5: Retrieving Data for Computation, Analysis, and Reference150 Questions
Exam 6: Evaluating the Financial Impact of Loans and Investments150 Questions
Exam 7: Organizing Data for Effective Analysis150 Questions
Exam 8: Using Data Tables and Excel Scenarios for What If Analysis150 Questions
Exam 9: Enhancing Decision Making with Solver150 Questions
Exam 10: Troubleshooting Workbooks and Automating Excel Applications150 Questions
Select questions type
Any data you enter in the row below an XML table will be added to the table.
(True/False)
4.8/5  (35)
(35)
To import data using an XML map, open the ____ task pane, and then click the XML Maps button.
(Multiple Choice)
4.8/5 (37)
A(n) ____________________ is similar in appearance and functionality to an Excel table, but the data is mapped to XML elements.
(Short Answer)
4.9/5 (30)
In the ____ function, text is the text string or cell reference that contains the space(s) that you want to remove.
(Multiple Choice)
4.8/5 (40)
In a computer application, the term "string" refers to a meaningful sequence of characters.
(True/False)
4.9/5 (43)
You can change the calculation used in the VALUES area by right-clicking a value in the VALUES area to open the shortcut menu, and then clicking Field Settings to open the ____ dialog box.
(Multiple Choice)
4.9/5 (37)
HTML documents are user-defined documents in which the user develops a DTD that defines the elements contained in a document.
(True/False)
4.9/5 (41)
The CONCATENATE function combines the values in a range of cells into ____ in a new cell.
(Multiple Choice)
5.0/5 (37)
MATCHING
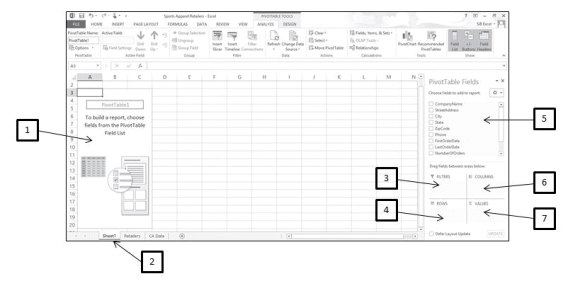 Identify the letter of the choice that best matches the PivotTable that has been added to the worksheet shown in the figure above.
-VALUES area
Identify the letter of the choice that best matches the PivotTable that has been added to the worksheet shown in the figure above.
-VALUES area
(Multiple Choice)
5.0/5 (32)
The syntax for the YEARFRAC function is as follows: =YEARFRAC(start_date,end_date,[basis]).
(True/False)
4.8/5 (41)
Case 7-1
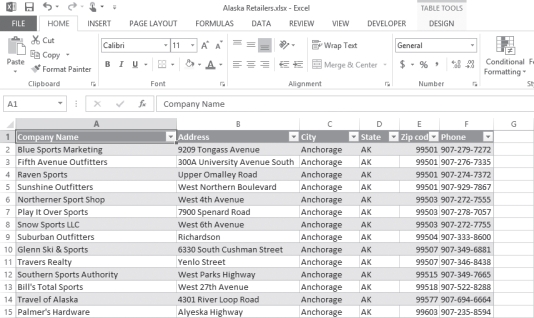 Julie is a sales manager, and she created the table above to organize her customer list. Please refer to the above figure when answering the questions below.
-When Julie first created the Excel table, the filter arrows did not appear in the header row for each column. To enable them, she clicked the Filter button in the ____ group on the DATA tab.
Julie is a sales manager, and she created the table above to organize her customer list. Please refer to the above figure when answering the questions below.
-When Julie first created the Excel table, the filter arrows did not appear in the header row for each column. To enable them, she clicked the Filter button in the ____ group on the DATA tab.
(Multiple Choice)
4.7/5 (37)
An Excel table is a range of ____ that you formalize as a single unit of data.
(Multiple Choice)
4.8/5 (37)
The LAST function returns the last character or characters in a text string, based on the number of characters specified. _________________________
(True/False)
4.8/5 (38)
The AutoFilter option called Text Filters removes any existing filters, displays all data in the column, and restores the default (Select All) option. _________________________
(True/False)
4.7/5 (43)
In the RIGHT function, the argument called ____ specifies the number of characters that you want the RIGHT function to extract.
(Multiple Choice)
4.9/5 (33)
You can add a row at the top of a worksheet (called a ____ row) and type labels that identify the data contained in each column.
(Multiple Choice)
4.9/5 (48)
The ____ function calculates the number of years between two dates.
(Multiple Choice)
4.7/5 (31)
MATCHING
Identify the letter of the choice that best matches the PivotTable that has been added to the worksheet shown in the figure above.
-ROWS area
(Multiple Choice)
4.8/5 (38)
The PivotTable ____ task pane contains a list of fields in the data source you selected for the PivotTable report.
(Multiple Choice)
4.8/5 (39)
Filters
- Essay(0)
- Multiple Choice(0)
- Short Answer(0)
- True False(0)
- Matching(0)