Exam 8: Using Data Tables and Excel Scenarios for What If Analysis
Exam 1: Applying Fundamental Excel Skills and Tools in Problem Solving150 Questions
Exam 2: Solving Problems with Statistical Analysis Tools150 Questions
Exam 3: Determining Effective Data Display with Charts150 Questions
Exam 4: Applying Logic in Decision Making150 Questions
Exam 5: Retrieving Data for Computation, Analysis, and Reference150 Questions
Exam 6: Evaluating the Financial Impact of Loans and Investments150 Questions
Exam 7: Organizing Data for Effective Analysis150 Questions
Exam 8: Using Data Tables and Excel Scenarios for What If Analysis150 Questions
Exam 9: Enhancing Decision Making with Solver150 Questions
Exam 10: Troubleshooting Workbooks and Automating Excel Applications150 Questions
Select questions type
Both one-variable data tables and two-variable data tables have ____________________ cells, which contain formulas that involve the input cells in their calculations in some way.
Free
(Short Answer)
4.9/5  (37)
(37)
Correct Answer: Verified
result
Although you can use generic names for your scenarios, you should use more descriptive names because they appear on any scenario summary reports you ____.
Free
(Multiple Choice)
4.8/5 (36)
Correct Answer:Verified
C
Identify the letter of the choice that best matches the word or phrase with its definition.
-Data table cells containing values that can vary
Free
(Multiple Choice)
4.8/5 (33)
Correct Answer:Verified
E
In a two-variable data table, you can vary the values of two input variables, and show the results for ____ output value(s).
(Multiple Choice)
5.0/5 (32)
If a business problem involved three break-even analyses, you could create ____ data table(s) by varying the unit price and sales projection values, but that would involve generating and printing each data table to compare the analyses.
(Multiple Choice)
4.9/5 (34)
To create a(n) scenario, you plan the input data you want to use and the results, or output, you want to achieve. _________________________
(True/False)
4.9/5 (26)
If a company decides to use income tax expense as a factor in analyses, a method it could use to compute the effects is ____.
(Multiple Choice)
4.8/5 (34)
Using ____ can make the process of creating scenarios and using them easier.
(Multiple Choice)
4.8/5 (35)
After you create a PivotTable report, you can analyze the information in a different form by generating an associated ____, which contains the same elements as a regular Excel chart.
(Multiple Choice)
4.9/5 (35)
A defined name can have a scope for the entire workbook, which is referred to as the ____________________ level.
(Short Answer)
4.9/5 (39)
Although a PivotTable usually summarizes information into different categories using functions such as ____, a scenario PivotTable lets you summarize the result cells from a scenario.
(Multiple Choice)
4.8/5 (37)
MATCHING
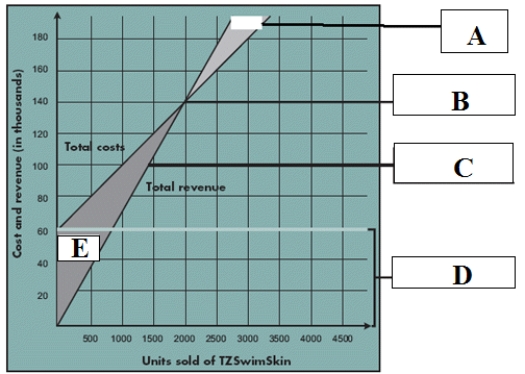 Identify the letter of the choice that best matches the break-even point in the chart above.
-Loss
Identify the letter of the choice that best matches the break-even point in the chart above.
-Loss
(Multiple Choice)
4.9/5 (24)
A contribution margin is calculated by subtracting variable expenses from sales, and represents the amount of revenue that contributes to covering the ____ expenses of a company.
(Multiple Choice)
4.9/5 (31)
Break-even analysis is a type of what-if analysis that concentrates on an activity at or around the point at which a product breaks even-or where the ____ is $0.
(Multiple Choice)
4.9/5 (34)
The contribution margin represents the amount of revenue that can contribute to covering the fixed expenses of a company. _________________________
(True/False)
4.7/5 (27)
What-if analysis allows you to see what output results if the values of various input assumptions change.
(True/False)
4.8/5 (39)
Because you can compare the results of many calculations in data tables, they can be very useful when performing a ____ analysis.
(Multiple Choice)
4.8/5 (38)
You can omit taxes from your estimates, or use your marginal tax rate.
(True/False)
4.8/5 (29)
To set up a scenario, you create or use a worksheet that contains sets of input cells and no output cells.
(True/False)
4.8/5 (37)
Filters
- Essay(0)
- Multiple Choice(0)
- Short Answer(0)
- True False(0)
- Matching(0)