Exam 2: Displaying and Describing Categorical Data
Exam 1: Data and Decisions41 Questions
Exam 2: Displaying and Describing Categorical Data45 Questions
Exam 3: Displaying and Describing Quantitative Data32 Questions
Exam 4: Correlation and Linear Regression84 Questions
Exam 5: Randomness and Probability34 Questions
Exam 6: Random Variables and Probability Models28 Questions
Exam 7: The Normal and Other Continuous Distributions31 Questions
Exam 8: Surveys and Sampling30 Questions
Exam 9: Sampling Distributions and Confidence Intervals for Proportions66 Questions
Exam 10: Testing Hypotheses About Proportions27 Questions
Exam 11: Confidence Intervals and Hypothesis Tests for Means28 Questions
Exam 12: Comparing Two Means35 Questions
Exam 13: Inference for Counts: Chi-Square Tests68 Questions
Exam 14: Inference for Regression38 Questions
Exam 15: Multiple Regression36 Questions
Exam 16: Introduction to Data Mining68 Questions
Select questions type
Find each of the following percentages.
A. What percent of the clients are over age 50 who invests in mutual funds?
b. What percent of clients over age 50 invest in mutual funds?
c. What percent of the mutual fund investors are over age 50?
(Essay)
4.9/5  (32)
(32)
A company interested in the health of its employees started a health program including monitoring blood pressure. Based on age, employees were categorized according to ranges of blood pressure by age intervals. Data are shown in the table below. . Age BP Under 30 - Over 50 Total Low 27 38 31 96 Normal 48 90 92 230 High 23 59 72 154 Total 98 187 195 480 The percentage of employees with normal or low blood pressure is
(Multiple Choice)
4.7/5 (40)
A clothing store uses comment cards to get feedback from its customers about newly added items. It recently introduced plus size fashion wear. Customers who purchased
The items were asked to fill out an online comment survey giving 10% off the next
Purchase. The data are summarized in the table below. Which of the following would be
An appropriate method for displaying the data shown in the table? Response Frequency Very satisfied. 15 Satisfied. 30 Less than fully satisfied. 12 Not satisfied. 4
(Multiple Choice)
4.8/5 (25)
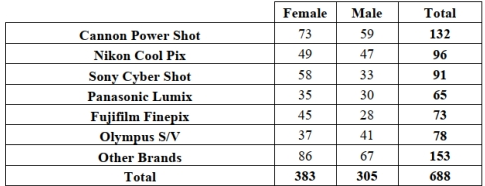
A large national retailer of electronics conducted a survey to determine consumer preferences for various brands of digital cameras and the data are summarized in the table shown below.
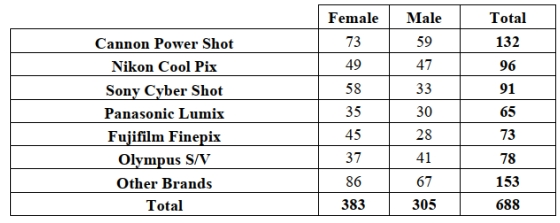 The percentage of consumers who are male and prefer Fujifilm is
(Multiple Choice)
4.8/5 (40)
A regional survey was carried out to gauge public opinion on the controversial Arizona Immigration Law (results shown below). How many respondents are
Republican and favor the law? Response Democrat Republican Independent Favor 50 93 35 Oppose 85 45 60 Don't Know 5 7 20
(Multiple Choice)
4.8/5 (30)
A regional survey was carried out to gauge public opinion on the controversial Arizona Immigration Law. Based on the results displayed in the table below, what
Percent of respondents is Independent? Response Democrat Republican Independent Favor 50 93 35 Oppose 85 45 60 Don't Know 5 7 20
(Multiple Choice)
4.7/5 (29)
A large national retailer of electronics conducted a survey to determine consumer preferences for various brands of digital cameras and the data are summarized in the table shown below.
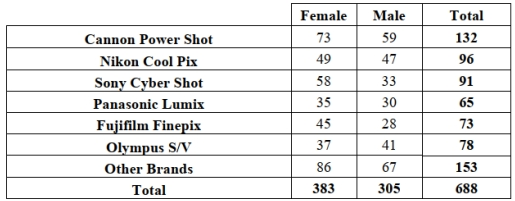 Of the consumers who are male, the percentage who prefer Sony is
(Multiple Choice)
4.8/5 (32)
Accenture, a consulting firm, conducted an online survey of 500 US consumers from 2009 to 2013. The results are displayed in the segmented bar chart below. How many
Respondents in 2012 are at least somewhat likely to shop on "Black Friday"? 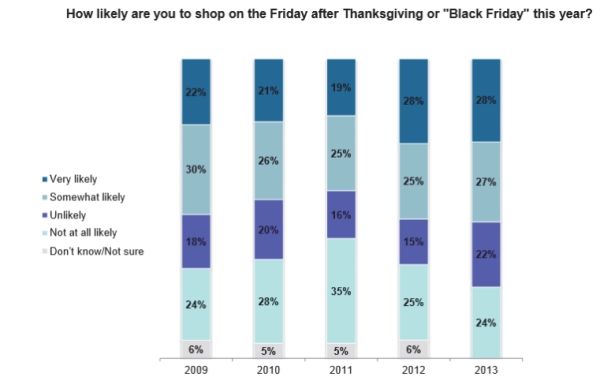
(Multiple Choice)
4.7/5 (45)
Prepare an appropriate chart to display the marginal distribution of age.
(Essay)
4.7/5 (46)
A regional survey was carried out to gauge public opinion on the controversial Arizona Immigration Law (results shown below). What percent oppose the law? Response Democrat Republican Independent Favor 50 93 35 Oppose 85 45 60 Don't Know 5 7 20
(Multiple Choice)
5.0/5 (31)
A clothing store uses comment cards to get feedback from its customers about newly added items. It recently introduced plus size fashion wear. Customers who purchased
The items were asked to fill out an online comment survey giving 10% off the next
Purchase. The data are summarized in the table below. What percentage of customers
Were at least satisfied with the item(s) purchased (Satisfied or Very satisfied)? Response Frequency Very satisfied. 15 Satisfied. 30 Less than fully satisfied. 12 Not satisfied. 4
(Multiple Choice)
4.9/5 (41)
A consulting firm examined the profit of two grocery stores and found that over the last year at Grocery Store A 66.7% of the months showed profit while at Grocery Store B 83.3% showed
Profit. The table below summarizes the findings. 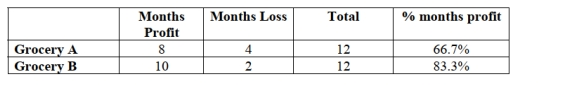 On closer investigation, it was observed that there was a difference in profit between stores that served wealthier neighborhoods versus less wealthy. The following tables were created:
Grocery stores serving wealthy neighborhoods:
On closer investigation, it was observed that there was a difference in profit between stores that served wealthier neighborhoods versus less wealthy. The following tables were created:
Grocery stores serving wealthy neighborhoods:
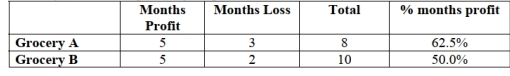 Grocery stores serving less wealthy neighborhoods: Months Profit Months Loss Total \% months profit Grocery A 2 2 4 50.0\% Grocery B 1 1 2 50.0\% What can be assumed about the profit of grocery stores?
(Multiple Choice)
4.9/5 (32)
A company interested in the health of its employees started a health program including monitoring blood pressure. Based on age, employees were categorized according to ranges of Blood pressure by age intervals. Data are shown in the table below. 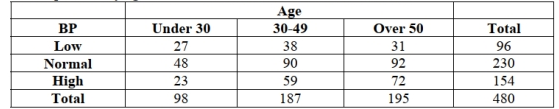
(Multiple Choice)
4.8/5 (37)
The following is a bar chart summarizing consumer preferences for various brands of digital cameras. 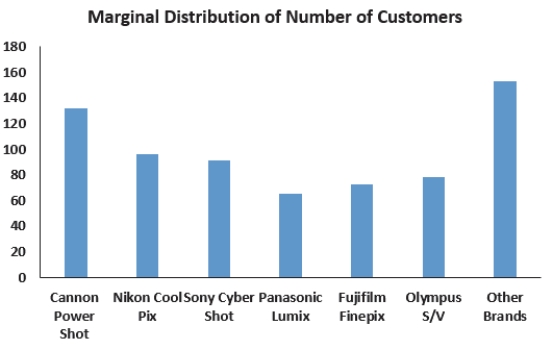 This bar chart shows
(Multiple Choice)
4.8/5 (39)
A regional survey was carried out to gauge public opinion on the controversial Arizona Immigration Law (results shown below). Of respondents who oppose the law,
What percent is Democrat? 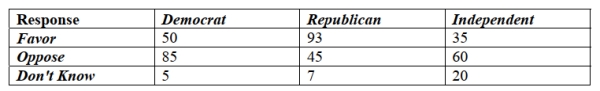
(Multiple Choice)
4.7/5 (36)
Identify the variables and tell whether each is categorical or quantitative.
(Essay)
4.7/5 (36)
Accenture, a consulting firm, conducted an online survey of 500 US consumers from in 2013. Response Male Female Too busy to shop earlier 115 75 More time to save for gifts 50 80 Better discounts available 65 20 Part of the holiday tradition 15 5 None of the above 120 60 What percentage of men were felt that better discounts were available on "Black Friday"?
(Multiple Choice)
4.8/5 (41)
Accenture, a consulting firm, conducted an online survey of 500 US consumers from 2009 to 2013. The results are displayed in the segmented bar chart below. Which of the
Following statement(s) is (are) true?
(Multiple Choice)
4.8/5 (31)
A large national retailer of electronics conducted a survey to determine consumer preferences for various brands of digital cameras and the data are summarized in the table shown below. Of the consumers who prefer Olympus, what percentage is female?
(Multiple Choice)
4.7/5 (32)
A company interested in the health of its employees started a health program including monitoring blood pressure. Based on age, employees were categorized according to ranges of Blood pressure by age intervals. Data are shown in the table below. 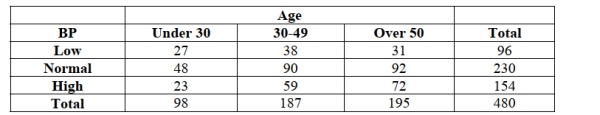 The percentage of employees who are over age 50 and have high blood pressure is
(Multiple Choice)
4.9/5 (43)
Filters
- Essay(0)
- Multiple Choice(0)
- Short Answer(0)
- True False(0)
- Matching(0)