Exam 2: Displaying and Describing Categorical Data
Exam 1: Data and Decisions41 Questions
Exam 2: Displaying and Describing Categorical Data45 Questions
Exam 3: Displaying and Describing Quantitative Data32 Questions
Exam 4: Correlation and Linear Regression84 Questions
Exam 5: Randomness and Probability34 Questions
Exam 6: Random Variables and Probability Models28 Questions
Exam 7: The Normal and Other Continuous Distributions31 Questions
Exam 8: Surveys and Sampling30 Questions
Exam 9: Sampling Distributions and Confidence Intervals for Proportions66 Questions
Exam 10: Testing Hypotheses About Proportions27 Questions
Exam 11: Confidence Intervals and Hypothesis Tests for Means28 Questions
Exam 12: Comparing Two Means35 Questions
Exam 13: Inference for Counts: Chi-Square Tests68 Questions
Exam 14: Inference for Regression38 Questions
Exam 15: Multiple Regression36 Questions
Exam 16: Introduction to Data Mining68 Questions
Select questions type
Write a sentence or two about the conditional relative frequency distribution of the
brands among female respondents.
(Essay)
4.7/5  (38)
(38)
Here is a stacked bar chart for data collected about employee blood pressure. 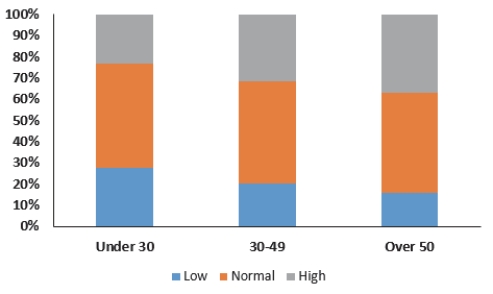 This chart shows
(Multiple Choice)
4.9/5 (31)
A restaurant uses comment cards to get feedback from its customers about newly added items to the menu. It recently introduced homemade organic veggie burgers.
Customers who tried the new burger were asked if they would order it again. The data
Are summarized in the table below. What percentage of customers would definitely order
The veggie burger again? Response Frequency Definitely would. 10 Most likely would. 40 Maybe 12 Definitely would not. 3
(Multiple Choice)
4.9/5 (32)
Find each of the following percentages. a. What percent of the responses were males who prefer Nikon?
b. What percent of the male responses prefer Olympus?
c. What percent of the consumers who choose Nikon were females?
(Essay)
4.8/5 (42)
Filters
- Essay(0)
- Multiple Choice(0)
- Short Answer(0)
- True False(0)
- Matching(0)