Exam 6: Correlation and Linear Regression
Exam 2: Data26 Questions
Exam 3: Surveys and Sampling Multiple Choice21 Questions
Exam 4: Displaying and Describing Categorical Data32 Questions
Exam 5: Displaying and Describing Quantitative Data17 Questions
Exam 6: Correlation and Linear Regression24 Questions
Exam 7: Randomness and Probability29 Questions
Exam 8: Random Variables and Probability Models20 Questions
Exam 9: Sampling Distributions and Confidence Intervals for Proportions16 Questions
Exam 10: Testing Hypotheses About Proportions16 Questions
Exam 11: Confidence Intervals and Hypothesis20 Questions
Exam 12: Comparing Two Groups13 Questions
Exam 13: Inference for Counts: Chi-Square17 Questions
Exam 14: Inference for Regression18 Questions
Exam 15: Multiple Regression18 Questions
Exam 16: Introduction to Data Mining20 Questions
Select questions type
Shown below is a correlation table showing correlation coefficients between stock price, earnings per share (EPS) and price/earnings (P/E) ratio for a sample of 19
Publicly traded companies.Which of the following statements is false?
Correlations: Stock Price, EPS, PE 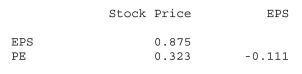
(Multiple Choice)
4.8/5  (37)
(37)
Suppose the correlation, r, between two variables x and y is -0.44.What would you predict about a y value if the x value is 2 standard deviations above its mean?
(Multiple Choice)
4.8/5 (29)
Data were collected on monthly sales revenues (in $1,000s) and monthly advertising expenditures ($100s) for a sample of drug stores.The regression line relating revenues
(Y) to advertising expenditure (X) is estimated to be 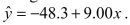 .The correct
Interpretation of the slope is that for each additional
.The correct
Interpretation of the slope is that for each additional
(Multiple Choice)
4.7/5 (30)
The scatterplot shows monthly sales figures (in units) and number of months of experience for a sample of salespeople. 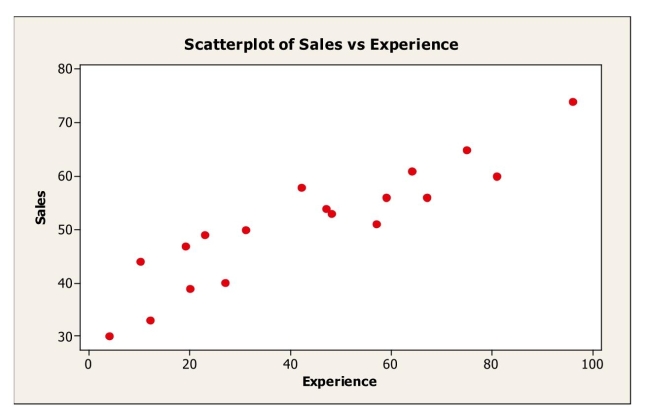 The association between monthly sales and level of experience can be described as
(Multiple Choice)
4.7/5 (37)
Filters
- Essay(0)
- Multiple Choice(0)
- Short Answer(0)
- True False(0)
- Matching(0)