Exam 14: Macroeconomic Policy: Challenges in a Global Economy
Exam 1: Exploring Economics324 Questions
Exam 2: Production, Economic Growth, and Trade346 Questions
Exam 3: Supply and Demand350 Questions
Exam 4: Markets and Government343 Questions
Exam 5: Introduction to Macroeconomics306 Questions
Exam 6: Measuring Inflation and Unemployment299 Questions
Exam 7: Economic Growth287 Questions
Exam 8: Aggregate Expenditures276 Questions
Exam 9: Aggregate Demand and Supply283 Questions
Exam 10: Fiscal Policy and Debt366 Questions
Exam 11: Saving, Investment, and the Financial System309 Questions
Exam 12: Money Creation and the Federal Reserve269 Questions
Exam 13: Monetary Policy331 Questions
Exam 14: Macroeconomic Policy: Challenges in a Global Economy270 Questions
Exam 15: International Trade262 Questions
Exam 16: Open Economy Macroeconomics265 Questions
Select questions type
Assume that nominal wages increase 10% and productivity increases 20%. Using the equation for the Phillips curve, inflation is
(Multiple Choice)
4.8/5  (41)
(41)
(Figure: Determining Curves) The curve in the graph represents a _____ curve. 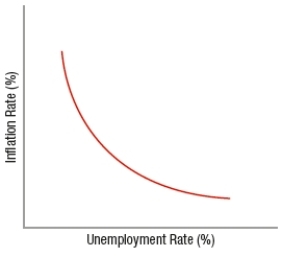
(Multiple Choice)
4.7/5 (38)
In a global economy, a problem with using fiscal and monetary policies to fix the problems in our country is that those policies
(Multiple Choice)
4.9/5 (37)
The contribution of the rational expectations theory to the long-run model is the understanding that
(Multiple Choice)
4.7/5 (40)
According to the equation for the Phillips curve, if nominal wages increase by 3% and productivity increases 2%, then inflation will change by
(Multiple Choice)
4.8/5 (35)
The Federal Reserve will most likely halt its quantitative easing program by
(Multiple Choice)
4.8/5 (31)
Using the equation for the Phillips curve, suppose that nominal wages increased by 5% and the inflation rate was 3%. What was the rate of increase in labor productivity?
(Multiple Choice)
4.9/5 (39)
The possible consequences of using fiscal and monetary policies to reduce unemployment are higher debt and the risk of inflation.
(True/False)
4.9/5 (29)
If policymakers attempt to reduce the rate of unemployment below its natural rate
(Multiple Choice)
4.8/5 (35)
The original Phillips curve shows the relationship between the rate of change in wages and the unemployment rate. Why is the change in wages strongly correlated with inflation? What assumption does the Phillips curve relationship make about productivity?
(Essay)
4.8/5 (37)
The graph that shows the tradeoff between inflation and money wages is called the
(Multiple Choice)
4.9/5 (23)
During the period 2008-2009, _____ million people lost their jobs.
(Multiple Choice)
4.8/5 (35)
(Figure: Understanding Phillips Curves) What is the natural rate of unemployment associated with Phillips curve PCa? 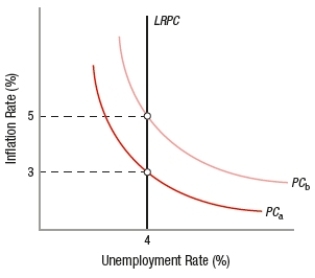
(Multiple Choice)
4.9/5 (35)
Ceteris paribus, if workers receive all their productivity increases in the form of higher wages, then wage inflation will remain stable.
(True/False)
5.0/5 (37)
Use an aggregate supply-aggregate demand diagram to illustrate the Great Recession.
(Essay)
4.8/5 (34)
The natural rate of unemployment occurs when the rate of increase in the wage is greater than the increase in productivity.
(True/False)
4.8/5 (35)
Filters
- Essay(0)
- Multiple Choice(0)
- Short Answer(0)
- True False(0)
- Matching(0)