Exam 4: Basic Probability
Exam 1: Introduction145 Questions
Exam 2: Organizing and Visualizing Data210 Questions
Exam 3: Numerical Descriptive Measures153 Questions
Exam 4: Basic Probability171 Questions
Exam 5: Discrete Probability Distributions218 Questions
Exam 6: The Normal Distribution and Other Continuous Distributions191 Questions
Exam 7: Sampling and Sampling Distributions197 Questions
Exam 8: Confidence Interval Estimation196 Questions
Exam 9: Fundamentals of Hypothesis Testing: One-Sample Tests165 Questions
Exam 10: Two-Sample Tests210 Questions
Exam 11: Analysis of Variance213 Questions
Exam 12: Chi-Square Tests and Nonparametric Tests201 Questions
Exam 13: Simple Linear Regression213 Questions
Exam 14: Introduction to Multiple Regression355 Questions
Exam 15: Multiple Regression Model Building96 Questions
Exam 16: Time-Series Forecasting168 Questions
Exam 17: Statistical Applications in Quality Management133 Questions
Exam 18: A Roadmap for Analyzing Data54 Questions
Exam 19: Questions that Involve Online Topics321 Questions
Select questions type
TABLE 4-4
Suppose that patrons of a restaurant were asked whether they preferred water or whether they preferred soda.70% said that they preferred water.60% of the patrons were male.80% of the males preferred water.
-Referring to Table 4-4,suppose a randomly selected patron is a female.Then the probability the patron prefers water is ________.
(Short Answer)
4.8/5  (28)
(28)
According to a survey of American households,the probability that the residents own 2 cars if annual household income is over $50,000 is 80%.Of the households surveyed,60% had incomes over $50,000 and 70% had 2 cars.The probability that annual household income is over $50,000 if the residents of a household do not own 2 cars is
(Multiple Choice)
4.8/5 (33)
TABLE 4-11
A sample of 300 adults is selected.The contingency table below shows their registration status and their preferred source of information on current events.
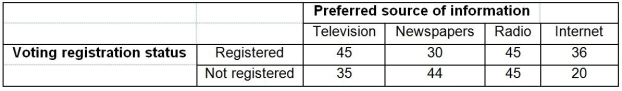 -Referring to Table 4-11,if an adult is selected at random,what is the probability that he/she is a registered voter who prefer to get his/her current information from the television?
(Short Answer)
4.8/5 (21)
If the outcome of event A is not affected by event B,then events A and B are said to be
(Multiple Choice)
4.8/5 (36)
TABLE 4-8
According to the record of the registrar's office at a state university,35% of the students are freshman,25% are sophomore,16% are junior and the rest are senior.Among the freshmen,sophomores,juniors and seniors,the portion of students who live in the dormitory are,respectively,80%,60%,30% and 20%.
-Referring to Table 4-8,what is the probability that a randomly selected student is a junior who does not live in a dormitory?
(Short Answer)
4.9/5 (47)
According to a survey of American households,the probability that the residents own 2 cars if annual household income is over $50,000 is 80%.Of the households surveyed,60% had incomes over $50,000 and 70% had 2 cars.The probability that annual household income is over $50,000 if the residents of a household own 2 cars is
(Multiple Choice)
4.9/5 (37)
TABLE 4-1
Mothers Against Drunk Driving is a very visible group whose main focus is to educate the public about the harm caused by drunk drivers.A study was recently done that emphasized the problem we all face with drinking and driving.Four hundred accidents that occurred on a Saturday night were analyzed.Two items noted were the number of vehicles involved and whether alcohol played a role in the accident.The numbers are shown below:
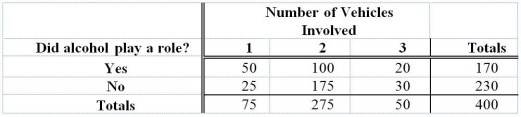 -Referring to Table 4-1,given that alcohol was not involved,what proportion of the accidents were multiple vehicle?
(Multiple Choice)
4.8/5 (40)
An investment consultant is recommending a certain class of mutual funds to the clienteles based on its exceptionally high probability of gain.It is an unethical practice not to also recommend a class of mutual funds with an exceptionally high probability of loss.
(True/False)
4.8/5 (35)
Suppose A and B are mutually exclusive events where P(A)= 0.4 and P(B)= 0.5.Then P(A and B)= ________.
(Short Answer)
4.9/5 (48)
TABLE 4-2
An alcohol awareness task force at a Big-Ten university sampled 200 students after the midterm to ask them whether they went bar hopping the weekend before the midterm or spent the weekend studying,and whether they did well or poorly on the midterm.The following result was obtained.
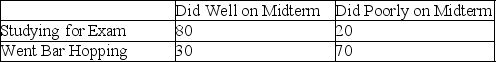 -Referring to Table 4-2,the events "Did Well on Midterm" and "Studying for Exam" are
(Multiple Choice)
4.8/5 (31)
TABLE 4-6
At a Texas college,60% of the students are from the southern part of the state,30% are from the northern part of the state,and the remaining 10% are from out-of-state.All students must take and pass an Entry Level Math (ELM)test.60% of the southerners have passed the ELM,70% of the northerners have passed the ELM,and 90% of the out-of-staters have passed the ELM.
-Referring to Table 4-6,if a randomly selected student has passed the ELM,the probability the student is from out-of-state is ________.
(Short Answer)
4.8/5 (38)
TABLE 4-3
A survey is taken among customers of a fast-food restaurant to determine preference for hamburger or chicken.Of 200 respondents selected,75 were children and 125 were adults.120 preferred hamburger and 80 preferred chicken.55 of the children preferred hamburger.
-Referring to Table 4-3,assume we know that a person prefers chicken.The probability that this individual is an adult is ________.
(Short Answer)
4.9/5 (39)
TABLE 4-8
According to the record of the registrar's office at a state university,35% of the students are freshman,25% are sophomore,16% are junior and the rest are senior.Among the freshmen,sophomores,juniors and seniors,the portion of students who live in the dormitory are,respectively,80%,60%,30% and 20%.
-Referring to Table 4-8,if a randomly selected student lives in the dormitory,what is the probability that the student is a freshman?
(Short Answer)
4.8/5 (42)
TABLE 4-6
At a Texas college,60% of the students are from the southern part of the state,30% are from the northern part of the state,and the remaining 10% are from out-of-state.All students must take and pass an Entry Level Math (ELM)test.60% of the southerners have passed the ELM,70% of the northerners have passed the ELM,and 90% of the out-of-staters have passed the ELM.
-Referring to Table 4-6,the probability that a randomly selected student is someone from northern Texas who has not passed the ELM is ________.
(Short Answer)
4.9/5 (41)
TABLE 4-11
A sample of 300 adults is selected.The contingency table below shows their registration status and their preferred source of information on current events.
-Referring to Table 4-11,if an adult is selected at random,what is the probability that he/she is a not a registered voter or does not prefer to get his/her current information from the Internet?
(Short Answer)
5.0/5 (36)
TABLE 4-11
A sample of 300 adults is selected.The contingency table below shows their registration status and their preferred source of information on current events.
-Referring to Table 4-11,if an adult is selected at random,what is the probability that he/she prefer to get his/her current information from the Internet?
(Short Answer)
4.8/5 (39)
TABLE 4-11
A sample of 300 adults is selected.The contingency table below shows their registration status and their preferred source of information on current events.
-Referring to Table 4-11,is the preferred source of current information independent of the voting registration status?
(Essay)
4.9/5 (40)
TABLE 4-2
An alcohol awareness task force at a Big-Ten university sampled 200 students after the midterm to ask them whether they went bar hopping the weekend before the midterm or spent the weekend studying,and whether they did well or poorly on the midterm.The following result was obtained.
-Referring to Table 4-2,the events "Did Well on Midterm" and "Did Poorly on Midterm" are
(Multiple Choice)
4.7/5 (28)
Suppose A and B are independent events where P(A)= 0.4 and P(B)= 0.5.Then P(A and B)= ________.
(Short Answer)
4.9/5 (37)
TABLE 4-10
Are whites more likely to claim bias? It was found that 60% of the workers were white,30% were black and 10% are other races.Given that a worker was white,the probability that the worker had claimed bias was 30%.Given that a worker was black,the probability that the worker had claimed bias was 40%.Given that a worker was other race,the probability that the worker had claimed bias was 0%.
-Referring to Table 4-10,what is the probability that a randomly selected worker is not black and had not claimed bias?
(Short Answer)
4.8/5 (29)
Filters
- Essay(0)
- Multiple Choice(0)
- Short Answer(0)
- True False(0)
- Matching(0)