Exam 2: Organizing and Visualizing Data
Exam 1: Introduction145 Questions
Exam 2: Organizing and Visualizing Data210 Questions
Exam 3: Numerical Descriptive Measures153 Questions
Exam 4: Basic Probability171 Questions
Exam 5: Discrete Probability Distributions218 Questions
Exam 6: The Normal Distribution and Other Continuous Distributions191 Questions
Exam 7: Sampling and Sampling Distributions197 Questions
Exam 8: Confidence Interval Estimation196 Questions
Exam 9: Fundamentals of Hypothesis Testing: One-Sample Tests165 Questions
Exam 10: Two-Sample Tests210 Questions
Exam 11: Analysis of Variance213 Questions
Exam 12: Chi-Square Tests and Nonparametric Tests201 Questions
Exam 13: Simple Linear Regression213 Questions
Exam 14: Introduction to Multiple Regression355 Questions
Exam 15: Multiple Regression Model Building96 Questions
Exam 16: Time-Series Forecasting168 Questions
Exam 17: Statistical Applications in Quality Management133 Questions
Exam 18: A Roadmap for Analyzing Data54 Questions
Exam 19: Questions that Involve Online Topics321 Questions
Select questions type
TABLE 2-10
The histogram below represents scores achieved by 200 job applicants on a personality profile.
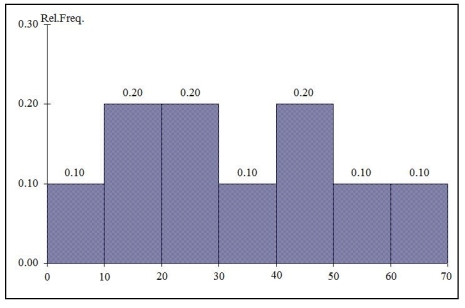 -Referring to the histogram from Table 2-10,________ percent of the applicants scored below 20 or at least 50.
Free
(Short Answer)
4.9/5  (32)
(32)
Correct Answer: Verified
50%
TABLE 2-14
The table below contains the number of people who own a portable DVD player in a sample of 600 broken down by gender.
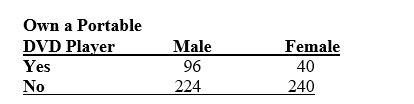 -Referring to Table 2-14,________ percent of the 600 did not own a portable DVD.
Free
(Short Answer)
4.8/5 (38)
Correct Answer:Verified
77.33%
A professor of economics at a small Texas university wanted to determine what year in school students were taking his tough economics course.Shown below is a pie chart of the results.What percentage of the class took the course prior to reaching their senior year? 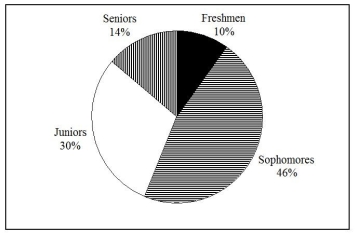
Free
(Multiple Choice)
4.8/5 (36)
Correct Answer:Verified
D
The relative frequency is the frequency in each class divided by the total number of observations.
(True/False)
4.9/5 (33)
TABLE 2-9
The frequency distribution below represents the rents of 250 randomly selected federally subsidized apartments in a small town. 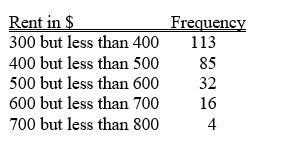 -Referring to Table 2-9,________ percent of the apartments rented for $600 or more.
(Short Answer)
4.7/5 (33)
A ________ is a vertical bar chart in which the rectangular bars are constructed at the boundaries of each class interval.
(Short Answer)
4.9/5 (26)
TABLE 2-1
An insurance company evaluates many numerical variables about a person before deciding on an appropriate rate for automobile insurance.A representative from a local insurance agency selected a random sample of insured drivers and recorded,X,the number of claims each made in the last 3 years,with the following results. 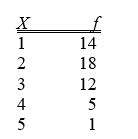 -A type of vertical bar chart in which the categories are plotted in the descending rank order of the magnitude of their frequencies is called a
(Multiple Choice)
4.7/5 (31)
A ________ is a summary table in which numerical data are tallied into class intervals or categories.
(Short Answer)
4.7/5 (37)
TABLE 2-13
Given below is the stem-and-leaf display representing the amount of detergent used in gallons (with leaves in tenths of gallons)in a day by 25 drive-through car wash operations in Phoenix.
9 | 1 4 7
10 | 0 2 2 3 8
11 | 1 3 5 5 6 6 7 7 7
12 | 2 2 3 4 8 9
13 | 0 2
-Referring to Table 2-13,construct a percentage histogram for the detergent data,using "9.0 but less than 10.0" as the first class.
(Essay)
4.8/5 (31)
You have collected data on the responses to two questions asked in a survey of 40 college students majoring in businessWhat is your gender? (Male = M; Female =F)and What is your major? (Accountancy = A; Computer Information Systems = C; Marketing = M).Which of the following is the best for presenting the data?
(Multiple Choice)
4.8/5 (33)
TABLE 2-18
The stem-and-leaf display below shows the result of a survey on 50 students on their satisfaction with their school with the higher scores represent higher level of satisfaction.
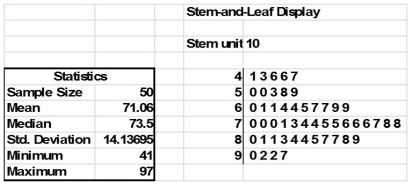 -Referring to Table 2-18,how many students have a satisfaction level below 60?
(Short Answer)
4.9/5 (45)
Data on the number of part-time hours students at a public university worked in a week were collected.Which of the following is the best chart for presenting the information?
(Multiple Choice)
4.8/5 (35)
TABLE 2-9
The frequency distribution below represents the rents of 250 randomly selected federally subsidized apartments in a small town.
-Referring to Table 2-9,the class midpoint of the second class is ________.
(Short Answer)
4.9/5 (38)
TABLE 2-12
The table below contains the opinions of a sample of 200 people broken down by gender about the latest congressional plan to eliminate anti-trust exemptions for professional baseball.
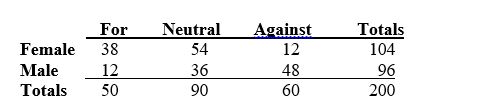 -Referring to Table 2-12,construct a table of column percentages.
(Essay)
4.8/5 (31)
TABLE 2-12
The table below contains the opinions of a sample of 200 people broken down by gender about the latest congressional plan to eliminate anti-trust exemptions for professional baseball.
-Referring to Table 2-12,________ percent of the 200 were against the plan.
(Short Answer)
4.9/5 (44)
TABLE 2-12
The table below contains the opinions of a sample of 200 people broken down by gender about the latest congressional plan to eliminate anti-trust exemptions for professional baseball.
-Referring to Table 2-12,of the males in the sample,________ percent were for the plan.
(Short Answer)
4.9/5 (40)
If you wish to construct a graph of a relative frequency distribution,you would most likely construct an ogive first.
(True/False)
4.8/5 (31)
TABLE 2-11
The ordered array below resulted from selecting a sample of 25 batches of 500 computer chips and determining how many in each batch were defective. 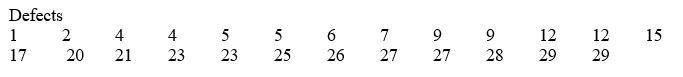 -Referring to Table 2-11,construct a cumulative percentage polygon for the defects data if the corresponding frequency distribution uses "0 but less than 5" as the first class.
(Essay)
4.7/5 (22)
Data on 1,500 students' height were collected at a larger university in the East Coast.Which of the following is the best chart for presenting the information?
(Multiple Choice)
5.0/5 (35)
TABLE 2-10
The histogram below represents scores achieved by 200 job applicants on a personality profile.
-Referring to the histogram from Table 2-10,half of the job applicants scored below ________.
(Short Answer)
4.9/5 (35)
Filters
- Essay(0)
- Multiple Choice(0)
- Short Answer(0)
- True False(0)
- Matching(0)