Exam 10: Two-Sample Tests
Exam 1: Introduction145 Questions
Exam 2: Organizing and Visualizing Data210 Questions
Exam 3: Numerical Descriptive Measures153 Questions
Exam 4: Basic Probability171 Questions
Exam 5: Discrete Probability Distributions218 Questions
Exam 6: The Normal Distribution and Other Continuous Distributions191 Questions
Exam 7: Sampling and Sampling Distributions197 Questions
Exam 8: Confidence Interval Estimation196 Questions
Exam 9: Fundamentals of Hypothesis Testing: One-Sample Tests165 Questions
Exam 10: Two-Sample Tests210 Questions
Exam 11: Analysis of Variance213 Questions
Exam 12: Chi-Square Tests and Nonparametric Tests201 Questions
Exam 13: Simple Linear Regression213 Questions
Exam 14: Introduction to Multiple Regression355 Questions
Exam 15: Multiple Regression Model Building96 Questions
Exam 16: Time-Series Forecasting168 Questions
Exam 17: Statistical Applications in Quality Management133 Questions
Exam 18: A Roadmap for Analyzing Data54 Questions
Exam 19: Questions that Involve Online Topics321 Questions
Select questions type
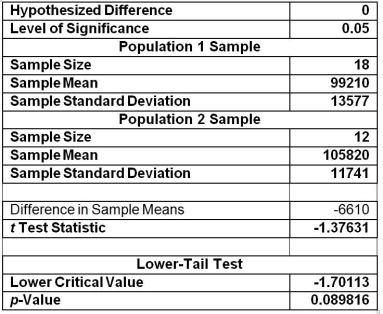
TABLE 10-2
A researcher randomly sampled 30 graduates of an MBA program and recorded data concerning their starting salaries.Of primary interest to the researcher was the effect of gender on starting salaries.The result of the pooled-variance t test of the mean salaries of the females (Population 1)and males (Population 2)in the sample is given below.
 -Referring to Table 10-2,what is the 99% confidence interval estimate for the difference between two means?
(Short Answer)
4.8/5  (36)
(36)
TABLE 10-8
A few years ago,Pepsi invited consumers to take the "Pepsi Challenge." Consumers were asked to decide which of two sodas,Coke or Pepsi,they preferred in a blind taste test.Pepsi was interested in determining what factors played a role in people's taste preferences.One of the factors studied was the gender of the consumer.Below are the results of analyses comparing the taste preferences of men and women with the proportions depicting preference for Pepsi.
Males: n = 109,pM = 0.422018 Females: n = 52,pF = 0.25
pM - pF = 0.172018 Z = 2.11825
-Referring to Table 10-8,construct a 90% confidence interval estimate of the difference between the proportion of males and females who prefer Pepsi.
(Short Answer)
4.9/5 (32)
In testing for the differences between the means of two related populations,you assume that the differences follow a ________ distribution.
(Short Answer)
4.9/5 (29)
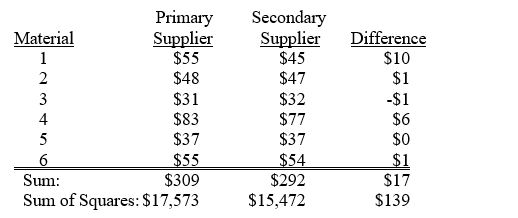
TABLE 10-7
A buyer for a manufacturing plant suspects that his primary supplier of raw materials is overcharging.In order to determine if his suspicion is correct,he contacts a second supplier and asks for the prices on various identical materials.He wants to compare these prices with those of his primary supplier.The data collected is presented in the table below,with some summary statistics presented (all of these might not be necessary to answer the questions which follow).The buyer believes that the differences are normally distributed and will use this sample to perform an appropriate test at a level of significance of 0.01.
 -Referring to Table 10-7,if the buyer had decided to perform a two-tail test,the p-value would have been ________.
(Essay)
4.9/5 (34)
TABLE 10-15
The table below presents the summary statistics for the starting annual salaries (in thousands of dollars)for individuals entering the public accounting and financial planning professions.
Sample I (public accounting):  ₁ = 60.35,S₁ = 3.25,n₁ = 12
Sample II (financial planning):
₁ = 60.35,S₁ = 3.25,n₁ = 12
Sample II (financial planning):  ₂ = 58.20,S₂ = 2.48,n₂ = 14
Test whether the mean starting annual salaries for individuals entering the public accounting professions is higher than that of financial planning assuming that the two population variances are the same.
-Referring to Table 10-15,what is(are)the critical value(s)of the relevant hypothesis test if the level of significance is 0.05?
₂ = 58.20,S₂ = 2.48,n₂ = 14
Test whether the mean starting annual salaries for individuals entering the public accounting professions is higher than that of financial planning assuming that the two population variances are the same.
-Referring to Table 10-15,what is(are)the critical value(s)of the relevant hypothesis test if the level of significance is 0.05?
(Short Answer)
4.9/5 (36)
A powerful women's group has claimed that men and women differ in attitudes about sexual discrimination.A group of 50 men (group 1)and 40 women (group 2)were asked if they thought sexual discrimination is a problem in the United States.Of those sampled,11 of the men and 19 of the women did believe that sexual discrimination is a problem.Assuming W designates women's responses and M designates men's,which of the following are the appropriate null and alternative hypotheses to test the group's claim?
(Multiple Choice)
4.7/5 (40)
TABLE 10-6
To investigate the efficacy of a diet,a random sample of 16 male patients is selected from a population of adult males using the diet.The weight of each individual in the sample is taken at the start of the diet and at a medical follow-up 4 weeks later.Assuming that the population of differences in weight before versus after the diet follow a normal distribution,the t test for related samples can be used to determine if there was a significant decrease in the mean weight during this period.Suppose the mean decrease in weights over all 16 subjects in the study is 3.0 pounds with the standard deviation of differences computed as 6.0 pounds.
-Referring to Table 10-6,what is the 90% confidence interval estimate for the mean difference in weight before and after the diet?
(Short Answer)
4.9/5 (33)
TABLE 10-11
The dean of a college is interested in the proportion of graduates from his college who have a job offer on graduation day.He is particularly interested in seeing if there is a difference in this proportion for accounting and economics majors.In a random sample of 100 of each type of major at graduation,he found that 65 accounting majors and 52 economics majors had job offers.If the accounting majors are designated as "Group 1" and the economics majors are designated as "Group 2," perform the appropriate hypothesis test using a level of significance of 0.05.
-Referring to Table 10-11,the hypotheses the dean should use are
(Multiple Choice)
4.8/5 (35)
The Wall Street Journal recently published an article indicating differences in perception of sexual harassment on the job between men and women.The article claimed that women perceived the problem to be much more prevalent than did men.One question asked of both men and women was: "Do you think sexual harassment is a major problem in the American workplace?" 24% of the men compared to 62% of the women responded "Yes." Assuming W designates women's responses and M designates men's,what hypothesis should The Wall Street Journal test in order to show that its claim is true?
(Multiple Choice)
4.8/5 (29)
TABLE 10-10
A corporation randomly selects 150 salespeople and finds that 66% who have never taken a self-improvement course would like such a course.The firm did a similar study 10 years ago in which 60% of a random sample of 160 salespeople wanted a self-improvement course.The groups are assumed to be independent random samples.Let π₁ and π₂ represent the true proportion of workers who would like to attend a self-improvement course in the recent study and the past study,respectively.
-Referring to Table 10-11,if the firm wanted to test whether this proportion has changed from the previous study,which represents the relevant hypotheses?
(Multiple Choice)
4.9/5 (42)
Filters
- Essay(0)
- Multiple Choice(0)
- Short Answer(0)
- True False(0)
- Matching(0)