Exam 10: Two-Sample Tests
Exam 1: Introduction145 Questions
Exam 2: Organizing and Visualizing Data210 Questions
Exam 3: Numerical Descriptive Measures153 Questions
Exam 4: Basic Probability171 Questions
Exam 5: Discrete Probability Distributions218 Questions
Exam 6: The Normal Distribution and Other Continuous Distributions191 Questions
Exam 7: Sampling and Sampling Distributions197 Questions
Exam 8: Confidence Interval Estimation196 Questions
Exam 9: Fundamentals of Hypothesis Testing: One-Sample Tests165 Questions
Exam 10: Two-Sample Tests210 Questions
Exam 11: Analysis of Variance213 Questions
Exam 12: Chi-Square Tests and Nonparametric Tests201 Questions
Exam 13: Simple Linear Regression213 Questions
Exam 14: Introduction to Multiple Regression355 Questions
Exam 15: Multiple Regression Model Building96 Questions
Exam 16: Time-Series Forecasting168 Questions
Exam 17: Statistical Applications in Quality Management133 Questions
Exam 18: A Roadmap for Analyzing Data54 Questions
Exam 19: Questions that Involve Online Topics321 Questions
Select questions type
TABLE 10-2
A researcher randomly sampled 30 graduates of an MBA program and recorded data concerning their starting salaries.Of primary interest to the researcher was the effect of gender on starting salaries.The result of the pooled-variance t test of the mean salaries of the females (Population 1)and males (Population 2)in the sample is given below.
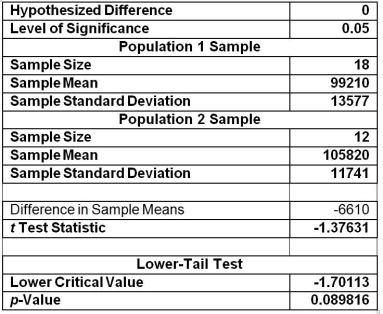 -Referring to Table 10-2,the researcher was attempting to show statistically that the female MBA graduates have a significantly lower mean starting salary than the male MBA graduates.From the analysis in Table 10-2,the correct test statistic is
(Multiple Choice)
4.8/5  (43)
(43)
If you wish to determine whether there is evidence that the proportion of items of interest is higher in Group 1 than in Group 2,and the test statistic for Z = +2.07 where the difference is defined as Group 1's proportion minus Group 2's proportion,the p-value is equal to ________.
(Short Answer)
4.8/5 (36)
TABLE 10-4
Two samples each of size 25 are taken from independent populations assumed to be normally distributed with equal variances.The first sample has a mean of 35.5 and standard deviation of 3.0 while the second sample has a mean of 33.0 and standard deviation of 4.0.
-Referring to Table 10-4,there are ________ degrees of freedom for this test.
(Short Answer)
4.8/5 (40)
TABLE 10-13
The amount of time required to reach a customer service representative has a huge impact on customer satisfaction.Below is the Excel output from a study to see whether there is evidence of a difference in the mean amounts of time required to reach a customer service representative between two hotels.Assume that the population variances in the amount of time for the two hotels are not equal.
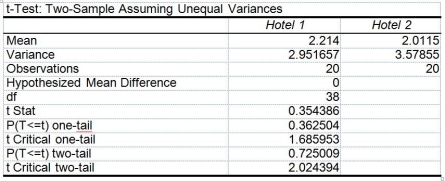 -Referring to Table 10-13,what is the value of the test statistic for testing if there is evidence of a difference in the variabilities of the amount of time required to reach a customer service representative between the two hotels?
(Short Answer)
4.8/5 (40)
TABLE 10-13
The amount of time required to reach a customer service representative has a huge impact on customer satisfaction.Below is the Excel output from a study to see whether there is evidence of a difference in the mean amounts of time required to reach a customer service representative between two hotels.Assume that the population variances in the amount of time for the two hotels are not equal.
-Referring to Table 10-13,what is the 95% confidence interval estimate for the difference in the two means if the two population variances are assumed to be the same?
(Short Answer)
4.8/5 (31)
TABLE 10-14
The use of preservatives by food processors has become a controversial issue.Suppose two preservatives are extensively tested and determined safe for use in meats.A processor wants to compare the preservatives for their effects on retarding spoilage.Suppose 15 cuts of fresh meat are treated with preservative I and 15 are treated with preservative II,and the number of hours until spoilage begins is recorded for each of the 30 cuts of meat.The results are summarized in the table below.
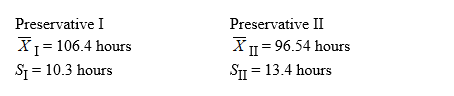 -Referring to Table 10-14,suppose α = 0.05.Which of the following represents the correct conclusion?
(Multiple Choice)
4.8/5 (35)
TABLE 10-11
The dean of a college is interested in the proportion of graduates from his college who have a job offer on graduation day.He is particularly interested in seeing if there is a difference in this proportion for accounting and economics majors.In a random sample of 100 of each type of major at graduation,he found that 65 accounting majors and 52 economics majors had job offers.If the accounting majors are designated as "Group 1" and the economics majors are designated as "Group 2," perform the appropriate hypothesis test using a level of significance of 0.05.
-Referring to Table 10-11,construct a 95% confidence interval estimate of the difference in proportion between accounting majors and economic majors who have a job offer on graduation day.
(Short Answer)
4.9/5 (38)
If we are testing for the difference between the means of 2 independent populations presuming equal variances with samples of n₁ = 20 and n₂ = 20,the number of degrees of freedom is equal to
(Multiple Choice)
4.8/5 (35)
TABLE 10-13
The amount of time required to reach a customer service representative has a huge impact on customer satisfaction.Below is the Excel output from a study to see whether there is evidence of a difference in the mean amounts of time required to reach a customer service representative between two hotels.Assume that the population variances in the amount of time for the two hotels are not equal.
-Referring to Table 10-13,state the null and alternative hypotheses for testing if there is evidence of a difference in the variabilities of the amount of time required to reach a customer service representative between the two hotels.
(Multiple Choice)
4.9/5 (40)
TABLE 10-7
A buyer for a manufacturing plant suspects that his primary supplier of raw materials is overcharging.In order to determine if his suspicion is correct,he contacts a second supplier and asks for the prices on various identical materials.He wants to compare these prices with those of his primary supplier.The data collected is presented in the table below,with some summary statistics presented (all of these might not be necessary to answer the questions which follow).The buyer believes that the differences are normally distributed and will use this sample to perform an appropriate test at a level of significance of 0.01.
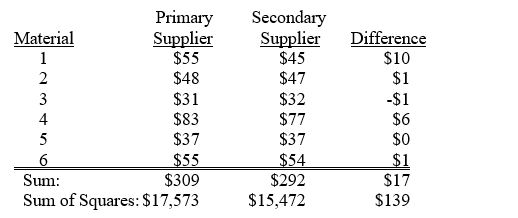 -Referring to Table 10-7,the hypotheses that the buyer should test are a null hypothesis that ________ versus an alternative hypothesis that ________.
(Short Answer)
4.9/5 (31)
In testing for the differences between the means of 2 independent populations where the variances in each population are unknown but assumed equal,the degrees of freedom are
(Multiple Choice)
4.7/5 (34)
-If we are testing for the difference between the means of 2 related populations with samples of n₁ = 20 and n₂ = 20,the number of degrees of freedom is equal to
(Multiple Choice)
4.8/5 (42)
TABLE 10-11
The dean of a college is interested in the proportion of graduates from his college who have a job offer on graduation day.He is particularly interested in seeing if there is a difference in this proportion for accounting and economics majors.In a random sample of 100 of each type of major at graduation,he found that 65 accounting majors and 52 economics majors had job offers.If the accounting majors are designated as "Group 1" and the economics majors are designated as "Group 2," perform the appropriate hypothesis test using a level of significance of 0.05.
-Referring to Table 10-11,the value of the test statistic is ________.
(Short Answer)
4.8/5 (50)
The t test for the mean difference between 2 related populations assumes that the
(Multiple Choice)
4.8/5 (36)
When testing H₀: π₁ - π₂ = 0 versus H₁: π₁ - π₂ ≠ 0,the observed value of the Z test statistic was found to be -2.13.The p-value for this test is
(Multiple Choice)
5.0/5 (43)
A powerful women's group has claimed that men and women differ in attitudes about sexual discrimination.A group of 50 men (group 1)and 40 women (group 2)were asked if they thought sexual discrimination is a problem in the United States.Of those sampled,11 of the men and 19 of the women did believe that sexual discrimination is a problem.Construct a 95% confidence interval estimate of the difference between the proportion of men and women who believe that sexual discrimination is a problem.
(Essay)
4.9/5 (36)
TABLE 10-11
The dean of a college is interested in the proportion of graduates from his college who have a job offer on graduation day.He is particularly interested in seeing if there is a difference in this proportion for accounting and economics majors.In a random sample of 100 of each type of major at graduation,he found that 65 accounting majors and 52 economics majors had job offers.If the accounting majors are designated as "Group 1" and the economics majors are designated as "Group 2," perform the appropriate hypothesis test using a level of significance of 0.05.
-Referring to Table 10-11,construct a 90% confidence interval estimate of the difference in proportion between accounting majors and economic majors who have a job offer on graduation day.
(Short Answer)
4.9/5 (34)
TABLE 10-3
A real estate company is interested in testing whether the mean time that families in Gotham have been living in their current homes is less than families in Metropolis.Assume that the two population variances are equal.A random sample of 100 families from Gotham and a random sample of 150 families in Metropolis yield the following data on length of residence in current homes.
Gotham:  G = 35 months, SG² = 900 Metropolis:
  M = 50 months,SM² = 1050
-Referring to Table 10-3,what is a point estimate for the mean of the sampling distribution of the difference between the 2 sample means?
M = 50 months,SM² = 1050
-Referring to Table 10-3,what is a point estimate for the mean of the sampling distribution of the difference between the 2 sample means?
(Multiple Choice)
4.7/5 (40)
TABLE 10-12
A quality control engineer is in charge of the manufacture of computer disks.Two different processes can be used to manufacture the disks.He suspects that the Kohler method produces a greater proportion of defects than the Russell method.He samples 150 of the Kohler and 200 of the Russell disks and finds that 27 and 18 of them,respectively,are defective.If Kohler is designated as "Group 1" and Russell is designated as "Group 2," perform the appropriate test at a level of significance of 0.01.
-Referring to Table 10-12,construct a 95% confidence interval estimate of the difference in proportion between the Kohler and Russell disks that are defective.
(Short Answer)
4.8/5 (33)
TABLE 10-11
The dean of a college is interested in the proportion of graduates from his college who have a job offer on graduation day.He is particularly interested in seeing if there is a difference in this proportion for accounting and economics majors.In a random sample of 100 of each type of major at graduation,he found that 65 accounting majors and 52 economics majors had job offers.If the accounting majors are designated as "Group 1" and the economics majors are designated as "Group 2," perform the appropriate hypothesis test using a level of significance of 0.05.
-Referring to Table 10-11,the p-value of the test is ________.
(Short Answer)
4.7/5 (36)
Filters
- Essay(0)
- Multiple Choice(0)
- Short Answer(0)
- True False(0)
- Matching(0)