Exam 11: Analysis of Variance
Exam 1: Introduction145 Questions
Exam 2: Organizing and Visualizing Data210 Questions
Exam 3: Numerical Descriptive Measures153 Questions
Exam 4: Basic Probability171 Questions
Exam 5: Discrete Probability Distributions218 Questions
Exam 6: The Normal Distribution and Other Continuous Distributions191 Questions
Exam 7: Sampling and Sampling Distributions197 Questions
Exam 8: Confidence Interval Estimation196 Questions
Exam 9: Fundamentals of Hypothesis Testing: One-Sample Tests165 Questions
Exam 10: Two-Sample Tests210 Questions
Exam 11: Analysis of Variance213 Questions
Exam 12: Chi-Square Tests and Nonparametric Tests201 Questions
Exam 13: Simple Linear Regression213 Questions
Exam 14: Introduction to Multiple Regression355 Questions
Exam 15: Multiple Regression Model Building96 Questions
Exam 16: Time-Series Forecasting168 Questions
Exam 17: Statistical Applications in Quality Management133 Questions
Exam 18: A Roadmap for Analyzing Data54 Questions
Exam 19: Questions that Involve Online Topics321 Questions
Select questions type
TABLE 11-4
An agronomist wants to compare the crop yield of 3 varieties of chickpea seeds.She plants 15 fields,5 with each variety.She then measures the crop yield in bushels per acre.Treating this as a completely randomized design,the results are presented in the table that follows. 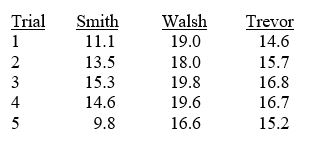 -Referring to Table 11-4,the agronomist decided to perform an ANOVA F test.The amount of total variation or SST is ________.
(Short Answer)
4.8/5  (35)
(35)
TABLE 11-4
An agronomist wants to compare the crop yield of 3 varieties of chickpea seeds.She plants 15 fields,5 with each variety.She then measures the crop yield in bushels per acre.Treating this as a completely randomized design,the results are presented in the table that follows.
-Referring to Table 11-4,based on the Tukey-Kramer procedure with an overall level of significance of 0.01,the agronomist would decide that there is a significant difference between the crop yield of Smith and Walsh seeds.
(True/False)
4.9/5 (47)
TABLE 11-5
A hotel chain has identically sized resorts in 5 locations.The data that follow resulted from analyzing the hotel occupancies on randomly selected days in the 5 locations.
 -Referring to Table 11-5,if a level of significance of 0.05 is chosen,the decision made indicates that at least 2 of the 5 locations have different mean occupancy rates.
(True/False)
4.9/5 (33)
TABLE 11-1
An airline wants to select a computer software package for its reservation system.Four software packages (1,2,3,and 4)are commercially available.The airline will choose the package that bumps as few passengers as possible during a month.An experiment is set up in which each package is used to make reservations for 5 randomly selected weeks.(A total of 20 weeks was included in the experiment.)The number of passengers bumped each week is obtained,which gives rise to the following Excel output:
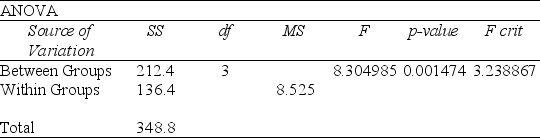 -Referring to Table 11-1,the total degrees of freedom is
(Multiple Choice)
4.8/5 (47)
TABLE 11-3
As part of an evaluation program,a sporting goods retailer wanted to compare the downhill coasting speeds of 4 brands of bicycles.She took 3 of each brand and determined their maximum downhill speeds.The results are presented in miles per hour in the table below. 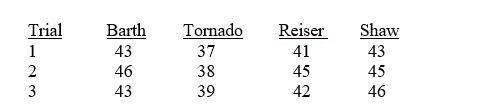 -Referring to Table 11-3,the sporting goods retailer decided to compare the 4 treatment means by using the Tukey-Kramer procedure with an overall level of significance of 0.05.There are ________ pairwise comparisons that can be made.
(Short Answer)
4.8/5 (35)
TABLE 11-3
As part of an evaluation program,a sporting goods retailer wanted to compare the downhill coasting speeds of 4 brands of bicycles.She took 3 of each brand and determined their maximum downhill speeds.The results are presented in miles per hour in the table below.
-Referring to Table 11-3,the test is robust to the violation of the assumption that the population of speeds is normally distributed.
(True/False)
4.8/5 (36)
TABLE 11-3
As part of an evaluation program,a sporting goods retailer wanted to compare the downhill coasting speeds of 4 brands of bicycles.She took 3 of each brand and determined their maximum downhill speeds.The results are presented in miles per hour in the table below.
-Referring to Table 11-3,the decision made implies that all 4 means are significantly different.
(True/False)
4.8/5 (38)
TABLE 11-5
A hotel chain has identically sized resorts in 5 locations.The data that follow resulted from analyzing the hotel occupancies on randomly selected days in the 5 locations.
-Referring to Table 11-5,what is the value of the test statistic for Levene's test for homogeneity of variances?
(Short Answer)
5.0/5 (33)
TABLE 11-3
As part of an evaluation program,a sporting goods retailer wanted to compare the downhill coasting speeds of 4 brands of bicycles.She took 3 of each brand and determined their maximum downhill speeds.The results are presented in miles per hour in the table below.
-Referring to Table 11-3,based on the Tukey-Kramer procedure with an overall level of significance of 0.05,the retailer would decide that there is a significant difference between all pairs of mean speeds.
(True/False)
4.8/5 (33)
TABLE 11-6
An agronomist wants to compare the crop yield of 3 varieties of chickpea seeds.She plants all 3 varieties of the seeds on each of 5 different patches of fields.She then measures the crop yield in bushels per acre.Treating this as a randomized block design,the results are presented in the table that follows. 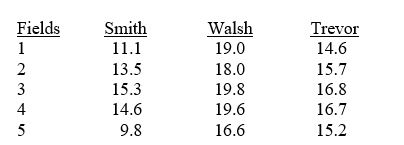 -Referring to Table 11-6,what are the degrees of freedom of the F test statistic for testing the block effects?
(Essay)
4.8/5 (29)
TABLE 11-12
The marketing manager of a company producing a new cereal aimed for children wants to examine the effect of the color and shape of the box's logo on the approval rating of the cereal.He combined 4 colors and 3 shapes to produce a total of 12 designs.Each logo was presented to 2 different groups (a total of 24 groups)and the approval rating for each was recorded and is shown below.The manager analyzed these data using the α = 0.05 level of significance for all inferences.
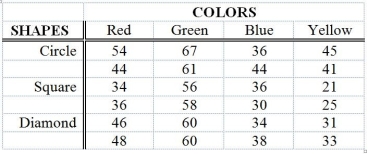
 -Referring to Table 11-12,the critical value in the test for significant differences between shapes is ________.
(Short Answer)
4.8/5 (41)
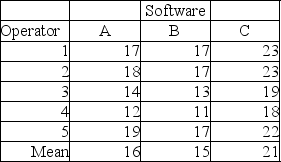
TABLE 11-8
An important factor in selecting database software is the time required for a user to learn how to use the system.To evaluate three potential brands (A,B and C)of database software,a company designed a test involving five different employees.To reduce variability due to differences among employees,each of the five employees is trained on each of the three different brands.The amount of time (in hours)needed to learn each of the three different brands is given below:
 Below is the Excel output for the randomized block design:
 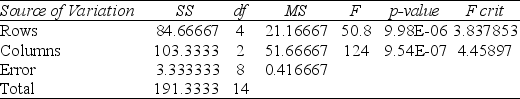 -Interaction in an experimental design can be tested in
(Multiple Choice)
4.9/5 (40)
TABLE 11-5
A hotel chain has identically sized resorts in 5 locations.The data that follow resulted from analyzing the hotel occupancies on randomly selected days in the 5 locations.
-Referring to Table 11-5,if a level of significance of 0.05 is chosen,the decision made indicates that all 5 locations have different mean occupancy rates.
(True/False)
4.9/5 (39)
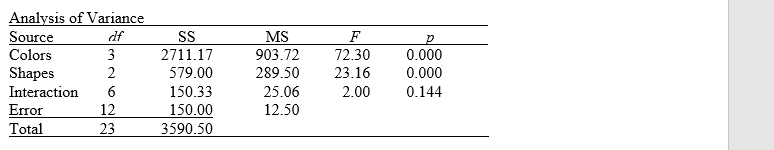
TABLE 11-12
The marketing manager of a company producing a new cereal aimed for children wants to examine the effect of the color and shape of the box's logo on the approval rating of the cereal.He combined 4 colors and 3 shapes to produce a total of 12 designs.Each logo was presented to 2 different groups (a total of 24 groups)and the approval rating for each was recorded and is shown below.The manager analyzed these data using the α = 0.05 level of significance for all inferences.
-Referring to Table 11-12,the value of the statistic used to test for significant differences between shapes is ________.
(Short Answer)
4.8/5 (39)
TABLE 11-9
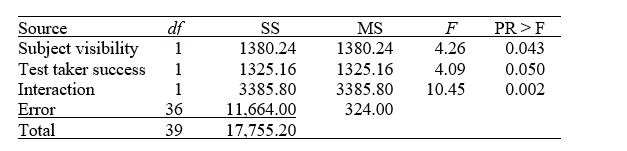
Psychologists have found that people are generally reluctant to transmit bad news to their peers.This phenomenon has been termed the "MUM effect." To investigate the cause of the MUM effect,40 undergraduates at Duke University participated in an experiment.Each subject was asked to administer an IQ test to another student and then provide the test taker with his or her percentile score.Unknown to the subject,the test taker was a bogus student who was working with the researchers.The experimenters manipulated two factors: subject visibility and success of test taker,each at two levels.Subject visibility was either visible or not visible to the test taker.Success of the test taker was either top 20% or bottom 20%.Ten subjects were randomly assigned to each of the 2 x 2 = 4 experimental conditions,then the time (in seconds)between the end of the test and the delivery of the percentile score from the subject to the test taker was measured.(This variable is called the latency to feedback.)The data were subjected to appropriate analyses with the following results.
 -A campus researcher wanted to investigate the factors that affect visitor travel time in a complex,multilevel building on campus.Specifically,he wanted to determine whether different building signs (building maps versus wall signage)affect the total amount of time visitors require to reach their destination and whether that time depends on whether the starting location is inside or outside the building.Three subjects were assigned to each of the combinations of signs and starting locations,and travel time in seconds from beginning to destination was recorded.How should the data be analyzed? Starting Room
Interior Exterior
Wall Signs 141,119,238 224,339,139
Map 85,94,126 226,129,130
-A campus researcher wanted to investigate the factors that affect visitor travel time in a complex,multilevel building on campus.Specifically,he wanted to determine whether different building signs (building maps versus wall signage)affect the total amount of time visitors require to reach their destination and whether that time depends on whether the starting location is inside or outside the building.Three subjects were assigned to each of the combinations of signs and starting locations,and travel time in seconds from beginning to destination was recorded.How should the data be analyzed? Starting Room
Interior Exterior
Wall Signs 141,119,238 224,339,139
Map 85,94,126 226,129,130
(Multiple Choice)
4.9/5 (41)
TABLE 11-11
A physician and president of a Tampa Health Maintenance Organization (HMO)are attempting to show the benefits of managed health care to an insurance company.The physician believes that certain types of doctors are more cost-effective than others.One theory is that primary specialty is an important factor in measuring the cost-effectiveness of physicians.To investigate this,the president obtained independent random samples of 20 HMO physicians from each of 4 primary specialtiesGeneral Practice (GP),Internal Medicine (IM),Pediatrics (PED),and Family Physicians (FP)and recorded the total charges per member per month for each.A second factor which the president believes influences total charges per member per month is whether the doctor is a foreign or US medical school graduate.The president theorizes that foreign graduates will have higher mean charges than US graduates.To investigate this,the president also collected data on 20 foreign medical school graduates in each of the 4 primary specialty types described above.So information on charges for 40 doctors (20 foreign and 20 US medical school graduates)was obtained for each of the 4 specialties.The results for the ANOVA are summarized in the following table.
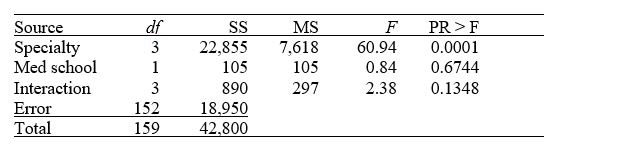 -Referring to Table 11-11,what degrees of freedom should be used to determine the critical value of the F ratio against which to test for differences between the mean charges of foreign and US medical school graduates?
(Multiple Choice)
4.9/5 (35)
TABLE 11-4
An agronomist wants to compare the crop yield of 3 varieties of chickpea seeds.She plants 15 fields,5 with each variety.She then measures the crop yield in bushels per acre.Treating this as a completely randomized design,the results are presented in the table that follows.
-Referring to Table 11-4,the decision made at 0.005 level of significance implies that all 3 means are significantly different.
(True/False)
4.9/5 (38)
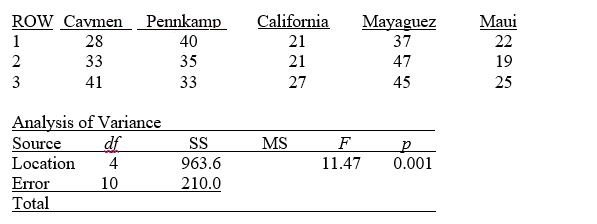
TABLE 11-5
A hotel chain has identically sized resorts in 5 locations.The data that follow resulted from analyzing the hotel occupancies on randomly selected days in the 5 locations.
-Referring to Table 11-5,what should be the decision for the Levene's test for homogeneity of variances at a 5% level of significance?
(Multiple Choice)
4.9/5 (38)
TABLE 11-5
A hotel chain has identically sized resorts in 5 locations.The data that follow resulted from analyzing the hotel occupancies on randomly selected days in the 5 locations.
-Referring to Table 11-5,the numerator and denominator degrees of freedom of the test ratio are ________ and ________,respectively.
(Short Answer)
4.8/5 (40)
TABLE 11-8
An important factor in selecting database software is the time required for a user to learn how to use the system.To evaluate three potential brands (A,B and C)of database software,a company designed a test involving five different employees.To reduce variability due to differences among employees,each of the five employees is trained on each of the three different brands.The amount of time (in hours)needed to learn each of the three different brands is given below:
Below is the Excel output for the randomized block design:
-Referring to Table 11-8,what are the degrees of freedom of the Studentized range distribution for the Tukey multiple comparison procedure?
(Essay)
4.8/5 (36)
Filters
- Essay(0)
- Multiple Choice(0)
- Short Answer(0)
- True False(0)
- Matching(0)