Exam 2: Analysis of Growth
Exam 1: Critical Thinking67 Questions
Exam 2: Analysis of Growth70 Questions
Exam 3: Linear and Exponential Change: Comparing Growth Rates72 Questions
Exam 4: Personal Finance71 Questions
Exam 5: Introduction to Probability68 Questions
Exam 6: Statistics69 Questions
Exam 7: Graph Theory70 Questions
Exam 8: Voting and Social Choice70 Questions
Exam 9: Geometry70 Questions
Select questions type
The following table shows the balance of an account at the end of each month after the initial deposit. 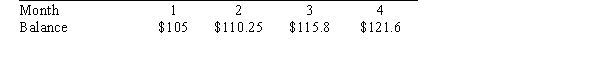 The balance as a function of time is _____ growth with _____ rate.
Free
(Multiple Choice)
4.7/5  (28)
(28)
Correct Answer: Verified
A
The following table shows the world population in billions: 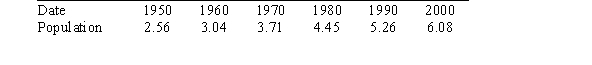 Calculate the average annual growth rate in millions from 1990 to 2000.
Free
(Multiple Choice)
4.9/5 (34)
Correct Answer:Verified
B
If you investigate the change of the U.S. population over years, then the dependent variable is the population.
Free
(True/False)
4.8/5 (30)
Correct Answer:Verified
True
A smoothed line graph is made from a _____ by joining data points smoothly with curves instead of showing line segments.
(Multiple Choice)
4.9/5 (28)
According to a report, the percentage of female students attending a nearby university rose from 58% in 1996 to 70% in 2004. This remained the percentage through 2010. If you wanted to make a line graph EMPHASIZING the increase, you would use a _____ range on the _____ axis.
(Multiple Choice)
4.9/5 (33)
_____ is the process of estimating unknown values between known data points using the average growth rate.
(Multiple Choice)
4.9/5 (34)
The following table shows the balance of a credit card at the end of each month. 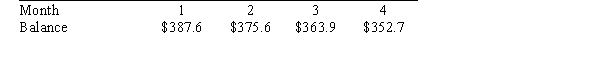 The balance as a function of time is _____ growth with _____ rate.
(Multiple Choice)
5.0/5 (30)
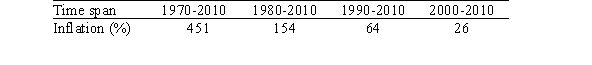
The following table shows the average price per barrel of crude oil in the given year:  In what year was crude oil most expensive (adjusted for inflation)? Use the following inflation table.

(Multiple Choice)
4.8/5 (42)
The following bar graph shows the annual attendance at a state fair: 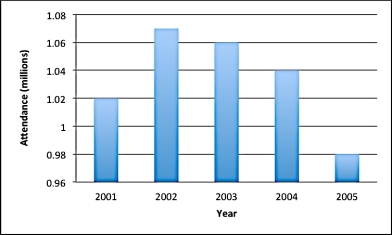 The chart seems to show a sharp increase in attendance from 2001 to 2002. Calculate the percentage change from 2001 to 2002.
(Multiple Choice)
4.8/5 (34)
When we adjust a graph for inflation, we report all currency amounts in _____ dollars.
(Multiple Choice)
4.9/5 (41)
The following table from the World Health Organization shows the cumulative number of severe acute respiratory syndrome (SARS) cases reported on certain dates in 2003:  Use extrapolation to estimate the number of cases reported on April 18.
(Multiple Choice)
4.7/5 (38)
The following table shows average prices per barrel of crude oil: 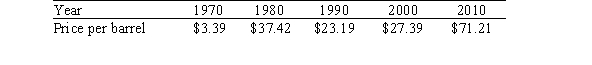 Excluding 1970, in what year was crude oil least expensive (adjusted for inflation)? Use the following inflation table.
(Multiple Choice)
4.9/5 (34)
The population in a certain city has been increasing at a decreasing rate. Which graph best represents this?
(Multiple Choice)
4.9/5 (36)
The following table from the World Health Organization shows the cumulative number of severe acute respiratory syndrome (SARS) cases reported on certain dates in 2003: 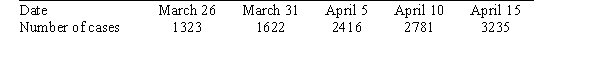 Use interpolation to estimate the number of cases reported on April 2.
(Multiple Choice)
4.7/5 (38)
The following table shows the number of customer complaints against a U.S. car rental company during the given year: 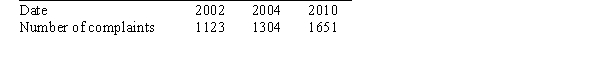 If the change from 2002 to 2006 is 32.4%, find the number of customer complaints during the year 2006.
(Multiple Choice)
4.9/5 (39)
Percentage _____ in a function is the percentage increase in the function from one value of the independent variable to another.
(Multiple Choice)
4.8/5 (27)
This bar graph shows the percentage of college freshmen at ABC College needing to take a developmental math class as of the fall of the given year: 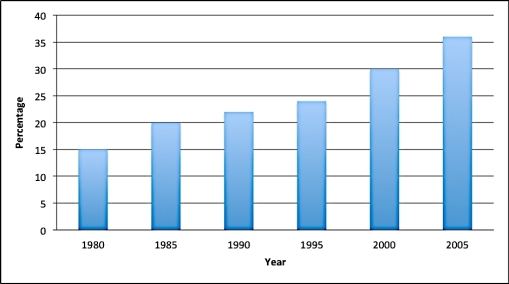 Find the average yearly growth rate from 1995 to 2000.
(Multiple Choice)
4.9/5 (33)
The following table shows the average starting salary of a certain job for the given year. 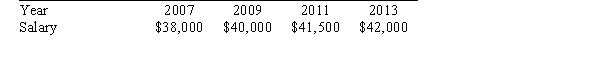 The starting salary as a function of time is _____ with _____ rate.
(Multiple Choice)
4.8/5 (38)
The amount of tax you owe is a function of your taxable income, with taxable income being the:
(Multiple Choice)
4.9/5 (33)
A _____ is a graph consisting of isolated points, with each dot corresponding to a data point.
(Multiple Choice)
4.8/5 (37)
Filters
- Essay(0)
- Multiple Choice(0)
- Short Answer(0)
- True False(0)
- Matching(0)