Exam 3: Numerical Descriptive Measures
Exam 1: Introduction145 Questions
Exam 2: Organizing and Visualizing Data210 Questions
Exam 3: Numerical Descriptive Measures153 Questions
Exam 4: Basic Probability171 Questions
Exam 5: Discrete Probability Distributions218 Questions
Exam 6: The Normal Distribution and Other Continuous Distributions191 Questions
Exam 7: Sampling and Sampling Distributions197 Questions
Exam 8: Confidence Interval Estimation196 Questions
Exam 9: Fundamentals of Hypothesis Testing: One-Sample Tests165 Questions
Exam 10: Two-Sample Tests210 Questions
Exam 11: Analysis of Variance213 Questions
Exam 12: Chi-Square Tests and Nonparametric Tests201 Questions
Exam 13: Simple Linear Regression213 Questions
Exam 14: Introduction to Multiple Regression355 Questions
Exam 15: Multiple Regression Model Building96 Questions
Exam 16: Time-Series Forecasting168 Questions
Exam 17: Statistical Applications in Quality Management133 Questions
Exam 18: A Roadmap for Analyzing Data54 Questions
Select questions type
TABLE 3-3
The ordered array below represents the number of vitamin supplements sold by a health food store in a sample of 16 days.
19, 19, 20, 20, 22, 23, 25, 26, 27, 30, 33, 34, 35, 36, 38, 41
Note: For this sample, the sum of the values is 448, and the sum of the squared differences between each value and the mean is 812.
-Referring to Table 3-3, the interquartile range of the number of vitamin supplements sold in this sample is ________.
Free
(Short Answer)
4.7/5  (47)
(47)
Correct Answer: Verified
15
Which of the following is the easiest to compute?
Free
(Multiple Choice)
4.8/5 (42)
Correct Answer:Verified
C
The rate of return for a stock over a three year period is 0.527, 0.145, and 0.684. The geometric mean rate of return is ________.
Free
(Short Answer)
4.8/5 (40)
Correct Answer:Verified
43.33% or 0.4333
TABLE 3-12
Given below are the rating and performance scores of 15 laptop computers.
Performance Score 115 191 153 194 236 184 184 216 185 183 189 202 192 141 187 Overall Rating 74 78 79 80 84 76 77 92 83 78 77 78 78 73 77
-Referring to Table 3-12, what is the sample correlation coefficient between the performance scores and the rating?
(Short Answer)
4.8/5 (34)
TABLE 3-13
Energy drink consumption has continued to gain in popularity since the 1997 debut of Red Bull, the current leader in the energy drink market. Given below are the exam scores and the number of 12-ounce energy drinks consumed within a week prior to the exam of 10 college students.
Exam Scores 75 92 84 64 64 86 81 61 73 93 Number of Drinks 5 3 2 4 2 7 3 0 1 0
-Referring to Table 3-13, what is the sample correlation coefficient between the exam scores and the number of energy drinks consumed?
(Short Answer)
4.9/5 (35)
TABLE 3-3
The ordered array below represents the number of vitamin supplements sold by a health food store in a sample of 16 days.
19, 19, 20, 20, 22, 23, 25, 26, 27, 30, 33, 34, 35, 36, 38, 41
Note: For this sample, the sum of the values is 448, and the sum of the squared differences between each value and the mean is 812.
-Referring to Table 3-3, construct a boxplot for the data in this sample.
(Essay)
4.9/5 (36)
TABLE 3-3
The ordered array below represents the number of vitamin supplements sold by a health food store in a sample of 16 days.
19, 19, 20, 20, 22, 23, 25, 26, 27, 30, 33, 34, 35, 36, 38, 41
Note: For this sample, the sum of the values is 448, and the sum of the squared differences between each value and the mean is 812.
-Referring to Table 3-3, what type of shape does the distribution of the sample appear to have?
(Essay)
4.8/5 (35)
TABLE 3-11
Given below are the closing prices for the Dow Jones Industrial Average (DJIA) and the Standard & Poor's (S&P) 500 Index over 10 weeks.
Dow Jones 10,421 10,110 9,863 10,475 9,92 10,593 11,213 10,933 11,134 10,316 S\&P 500 1,379 1,356 1,343 1,410 1,389 1,463 1,529 1,499 1,516 1,355
-Referring to Table 3-11, what is the sample correlation coefficient between the DJIA and the S&P 500 index?
(Short Answer)
4.9/5 (38)
The rate of return for the S&P 500 over a four year period is -0.029, -0.061, -0.493, and -0.286. The geometric mean rate of return per year is ________.
(Short Answer)
4.7/5 (35)
Which of the following is not a measure of central tendency?
(Multiple Choice)
4.9/5 (32)
A manufacturer of flashlight batteries took a sample of 130 batteries from a day's production and used them continuously until they were drained. The number of hours until failure are recorded. Given below is the boxplot of the number of hours it took to drain each of the 130 batteries. The distribution of the number of hours is 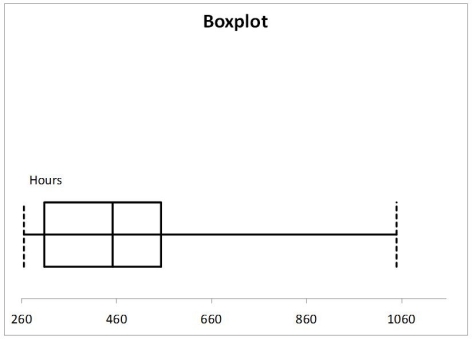
(Multiple Choice)
4.8/5 (41)
TABLE 3-7
In a recent academic year, many public universities in the United States raised tuition and fees due to a decrease in state subsidies. The change in the cost of tuition, a shared dormitory room, and the most popular meal plan from the previous academic year for a sample of 10 public universities were as follows: $1,589, $593, $1,223, $869, $423, $1,720, $708, $1425, $922 and $308.
-Referring to Table 3-7, what is the interquartile range of the change in the cost?
(Short Answer)
5.0/5 (33)
A population with 200 elements has an arithmetic mean of 10. From this information, it can be shown that the population standard deviation is 15.
(True/False)
4.8/5 (37)
TABLE 3-4
The ordered array below represents the number of cargo manifests approved by customs inspectors of the Port of New York in a sample of 35 days:
16, 17, 18, 18, 19, 20, 20, 21, 21, 21, 22, 22, 22, 22, 23, 23, 23, 23, 24, 24, 24, 25, 25, 26, 26, 26, 27, 28, 28, 29, 29, 31, 31, 32, 32
Note: For this sample, the sum of the values is 838, and the sum of the squared differences between each value and the mean is 619.89.
-Referring to Table 3-4, the range of the customs data is ________.
(Short Answer)
4.8/5 (32)
TABLE 3-3
The ordered array below represents the number of vitamin supplements sold by a health food store in a sample of 16 days.
19, 19, 20, 20, 22, 23, 25, 26, 27, 30, 33, 34, 35, 36, 38, 41
Note: For this sample, the sum of the values is 448, and the sum of the squared differences between each value and the mean is 812.
-Referring to Table 3-3, the third quartile of the number of vitamin supplements sold in this sample is ________.
(Short Answer)
4.8/5 (40)
TABLE 3-2
The data below represent the amount of grams of carbohydrates in a serving of breakfast cereal in a sample of 11 different servings.
11 15 23 29 19 22 21 20 15 25 17
-Referring to Table 3-2, the first quartile of the carbohydrate amounts is ________ grams.
(Short Answer)
4.9/5 (32)
TABLE 3-4
The ordered array below represents the number of cargo manifests approved by customs inspectors of the Port of New York in a sample of 35 days:
16, 17, 18, 18, 19, 20, 20, 21, 21, 21, 22, 22, 22, 22, 23, 23, 23, 23, 24, 24, 24, 25, 25, 26, 26, 26, 27, 28, 28, 29, 29, 31, 31, 32, 32
Note: For this sample, the sum of the values is 838, and the sum of the squared differences between each value and the mean is 619.89.
-Referring to Table 3-4, the variance of the customs data is ________.
(Short Answer)
4.9/5 (32)
According to the empirical rule, if the data form a "bell-shaped" normal distribution, ________ percent of the observations will be contained within 1 standard deviation around the arithmetic mean.
(Multiple Choice)
4.8/5 (32)
The five-number summary consists of the smallest value, the first quartile, the median, the third quartile, and the largest value.
(True/False)
5.0/5 (41)
Filters
- Essay(0)
- Multiple Choice(0)
- Short Answer(0)
- True False(0)
- Matching(0)