Exam 2: Organizing and Visualizing Data
Exam 1: Introduction145 Questions
Exam 2: Organizing and Visualizing Data210 Questions
Exam 3: Numerical Descriptive Measures153 Questions
Exam 4: Basic Probability171 Questions
Exam 5: Discrete Probability Distributions218 Questions
Exam 6: The Normal Distribution and Other Continuous Distributions191 Questions
Exam 7: Sampling and Sampling Distributions197 Questions
Exam 8: Confidence Interval Estimation196 Questions
Exam 9: Fundamentals of Hypothesis Testing: One-Sample Tests165 Questions
Exam 10: Two-Sample Tests210 Questions
Exam 11: Analysis of Variance213 Questions
Exam 12: Chi-Square Tests and Nonparametric Tests201 Questions
Exam 13: Simple Linear Regression213 Questions
Exam 14: Introduction to Multiple Regression355 Questions
Exam 15: Multiple Regression Model Building96 Questions
Exam 16: Time-Series Forecasting168 Questions
Exam 17: Statistical Applications in Quality Management133 Questions
Exam 18: A Roadmap for Analyzing Data54 Questions
Select questions type
TABLE 2-14
The table below contains the number of people who own a portable DVD player in a sample of 600 broken down by gender.
Own a Portable DVD Player Male Female Yes 96 40 No 224 240
-Referring to Table 2-14, ________ percent of the 600 were males who owned a portable DVD.
Free
(Short Answer)
4.8/5  (40)
(40)
Correct Answer: Verified
16%
In graphing two categorical data, the side-by-side bar chart is best suited when comparing joint responses.
Free
(True/False)
4.8/5 (32)
Correct Answer:Verified
True
TABLE 2-18
The stem-and-leaf display below shows the result of a survey on 50 students on their satisfaction with their school with the higher scores represent higher level of satisfaction.
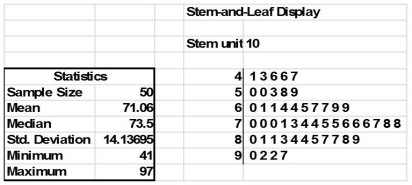 -Referring to Table 2-18, how many students have a satisfaction level in the 50s?
Free
(Short Answer)
4.7/5 (34)
Correct Answer:Verified
5
TABLE 2-6
A sample of 200 students at a Big-Ten university was taken after the midterm to ask them whether they went bar hopping the weekend before the midterm or spent the weekend studying, and whether they did well or poorly on the midterm. The following table contains the result.
Did Well in Midterm Did Poorly in Midterm Studying for Exam 80 20 Went Bar Hopping 30 70
-Referring to Table 2-6, if the sample is a good representation of the population, we can expect ________ percent of those who did poorly on the midterm to have spent the weekend studying.
(Multiple Choice)
4.7/5 (34)
TABLE 2-14
The table below contains the number of people who own a portable DVD player in a sample of 600 broken down by gender.
Own a Portable DVD Player Male Female Yes 96 40 No 224 240
-Referring to Table 2-14, of those who did not own a portable DVD in the sample, ________ percent were males.
(Short Answer)
4.8/5 (33)
TABLE 2-11
The ordered array below resulted from selecting a sample of 25 batches of 500 computer chips and determining how many in each batch were defective.
Defects 1 2 4 4 5 5 6 7 9 9 12 12 15 17 20 21 23 23 25 26 27 27 28 29 29
-Referring to Table 2-11, construct a histogram for the defects data, using "0 but less than 5" as the first class.
(Essay)
4.8/5 (33)
TABLE 2-6
A sample of 200 students at a Big-Ten university was taken after the midterm to ask them whether they went bar hopping the weekend before the midterm or spent the weekend studying, and whether they did well or poorly on the midterm. The following table contains the result.
Did Well in Midterm Did Poorly in Midterm Studying for Exam 80 20 Went Bar Hopping 30 70
-Referring to Table 2-6, ________ percent of the students in the sample went bar hopping the weekend before the midterm and did well on the midterm.
(Multiple Choice)
4.9/5 (44)
TABLE 2-16
The figure below is the percentage polygon for the amount of calories for a sample of 36 pizzas products where the upper limits of the intervals are: 310, 340, 370, 400 and 430.
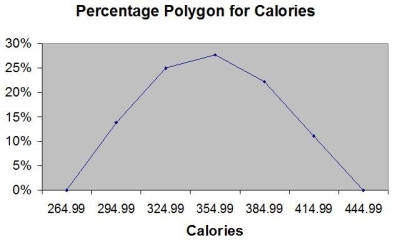 -Referring to Table 2-16, roughly what percentage of pizza products contains at least 340 calories?
(Multiple Choice)
4.8/5 (29)
TABLE 2-12
The table below contains the opinions of a sample of 200 people broken down by gender about the latest congressional plan to eliminate anti-trust exemptions for professional baseball.
For Neutral Aqainst Totals Female 38 54 12 104 Male 12 36 48 96 Totals 50 90 60 200
-Referring to Table 2-12, ________ percent of the 200 were against the plan.
(Short Answer)
4.9/5 (30)
TABLE 2-12
The table below contains the opinions of a sample of 200 people broken down by gender about the latest congressional plan to eliminate anti-trust exemptions for professional baseball.
For Neutral Aqainst Totals Female 38 54 12 104 Male 12 36 48 96 Totals 50 90 60 200
-Referring to Table 2-12, of the females in the sample, ________ percent were either neutral or against the plan.
(Short Answer)
4.8/5 (39)
In constructing a polygon, each class grouping is represented by its ________ and then these are consecutively connected to one another.
(Short Answer)
4.7/5 (37)
The larger the number of observations in a numerical data set, the larger the number of class intervals needed for a grouped frequency distribution.
(True/False)
4.8/5 (30)
You have collected data on the responses to two questions asked in a survey of 40 college students majoring in businessWhat is your gender? (Male = M; Female =F) and What is your major? (Accountancy = A; Computer Information Systems = C; Marketing = M). Which of the following is the best for presenting the data?
(Multiple Choice)
4.8/5 (37)
TABLE 2-13
Given below is the stem-and-leaf display representing the amount of detergent used in gallons (with leaves in tenths of gallons) in a day by 25 drive-through car wash operations in Phoenix.
11 | 135566777
-Referring to Table 2-13, construct a frequency distribution for the detergent data, using "9.0 but less than 10.0 gallons" as the first class.
(Essay)
4.7/5 (38)
TABLE 2-14
The table below contains the number of people who own a portable DVD player in a sample of 600 broken down by gender.
Own a Portable DVD Player Male Female Yes 96 40 No 224 240
-Referring to Table 2-14, construct a table of total percentages.
(Essay)
4.9/5 (25)
TABLE 2-17
The following table presents total retail sales in millions of dollars for the leading apparel companies during April 2009 and April 2010.
APPAREL COMPANY April2009 April 2010 Gap 1,159.00 962 TJX 781.7 899 Limited 596.5 620.4 Kohl's 544.9 678.9 Nordstrom 402.6 418.3 Talbots 139.9 130.1 Ann Taylor 114.2 124.8
-Referring to Table 2-17, construct a table of column percentages.
(Essay)
4.7/5 (33)
TABLE 2-12
The table below contains the opinions of a sample of 200 people broken down by gender about the latest congressional plan to eliminate anti-trust exemptions for professional baseball.
For Neutral Aqainst Totals Female 38 54 12 104 Male 12 36 48 96 Totals 50 90 60 200
-Referring to Table 2-12, of the females in the sample, ________ percent were against the plan.
(Short Answer)
4.9/5 (33)
The sum of cumulative frequencies in a distribution always equals 1.
(True/False)
4.8/5 (30)
When polygons or histograms are constructed, which axis must show the true zero or "origin"?
(Multiple Choice)
4.9/5 (32)
TABLE 2-15
The figure below is the ogive for the amount of fat (in grams) for a sample of 36 pizza products where the upper boundaries of the intervals are: 5, 10, 15, 20, 25, and 30.
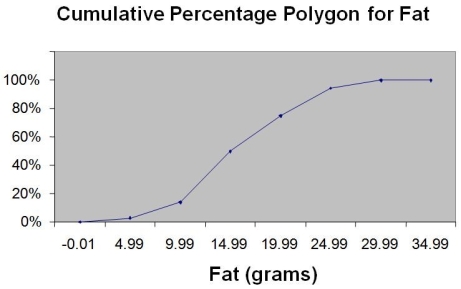 -Referring to Table 2-15, what percentage of pizza products contains between 10 and 25 grams of fat?
(Multiple Choice)
4.7/5 (41)
Filters
- Essay(0)
- Multiple Choice(0)
- Short Answer(0)
- True False(0)
- Matching(0)