Exam 7: Statistical Inference: Estimating a Population Mean
Exam 1: An Introduction to Statistics44 Questions
Exam 2: Descriptive Statistics I: Elementary Data Presentation and Description147 Questions
Exam 3: Descriptive Statistics II: Additional Descriptive Measures and Data Displays128 Questions
Exam 4: Probability147 Questions
Exam 5: Discrete Probability Distributions144 Questions
Exam 6: Continuous Probability Distributions141 Questions
Exam 7: Statistical Inference: Estimating a Population Mean134 Questions
Exam 8: Interval Estimates for Proportions, Mean Differences and Proportion Differences19 Questions
Exam 9: Statistical Hypothesis Testing: Hypothesis Tests for a Population Mean62 Questions
Exam 10: Hypothesis Tests for Proportions, Mean Differences and Proportion Differences39 Questions
Exam 11: Basic Regression Analysis111 Questions
Exam 12: Multiple Regression53 Questions
Exam 13: F Tests and Analysis of Variance95 Questions
Exam 14: Experimental Designonline Only64 Questions
Exam 16: Chi-Square Tests145 Questions
Select questions type
The US department of Agriculture wants to estimate the acres of corn that Iowa farmers will plant in the coming year.Suppose five Iowa farmers are selected at random and asked how many acres of corn they plan to plant.Results of the survey are given below:  If there are 7500 farms in Iowa, give the 95% confidence interval estimate of the TOTAL number of corn acres that Iowa farmers intend to plant.Show the upper bound for your interval.
(Multiple Choice)
4.8/5  (33)
(33)
You want to estimate the average GMAT score for all students who took the Logitano GMAT Preparation course during the past 2 years.You select a random sample of 12 such students from a comprehensive list of all Logitano students who took the course over the last two years and find that the average GMAT score for the sample was 1040.The population standard deviation is unknown, but the sample standard deviation is 83 points.Assume that the population distribution is approximately normal.Produce the 95% confidence interval estimate of the mean GMAT score for the population of Logitano students over the past two years.Report the upper bound for your interval.
(Multiple Choice)
4.8/5 (34)
Suppose you plan to build a 90% confidence interval estimate of a population mean, using a sample of size 3.You will be estimating the population standard deviation with the sample standard deviation.Assuming the population distribution is approximately normal, the appropriate t value for your interval would be _____ .If you had used a z score instead of the t value here, the z score for the 90% interval would be much too small.In fact the z score for a 90% interval is only ______ .
(Multiple Choice)
4.8/5 (39)
Which of the following best describes the sampling distribution of the sample mean?
(Multiple Choice)
4.9/5 (35)
One of the factors that plays a significant role in determining the sample size needed to achieve a desired margin of error is the:
(Multiple Choice)
4.7/5 (39)
Using the t table, determine the proper boundaries for a 98% interval (symmetric about the center) for a t distribution with df = 24.Report the upper bound.
(Multiple Choice)
4.8/5 (42)
Using the cluster random sampling method would be most useful when:
(Multiple Choice)
4.8/5 (44)
In statistical inference, data from the sample is used to estimate the population parameter.
(True/False)
4.9/5 (44)
Crownfashions.com wants to estimate the average time that visitors to its website spend browsing the site.In a random sample of 49 visits this week, average browsing time is 13.6 minutes.Assume you know the population standard deviation is 5.2 minutes.Construct an 80% confidence interval estimate of average browsing time for the population of crownfashion.com visitors this week.Report the margin of error indicated by the interval.
(Multiple Choice)
4.9/5 (37)
For a sample 1000 Twitter users, Tele-Market Research reports an average age of 39.If the population standard deviation is 9.5 years, what would be the upper bound for a 90% confidence interval estimate of the mean age of all Twitter users?
(Multiple Choice)
4.9/5 (36)
In a random sample of 341 U.S.companies, the average number of paid sick days allowed company employees was 18.65.The margin of error was reported as 1 day, at the 95% confidence level.If you were to build a 90% confidence interval here, the margin of error would be how many day(s).
(Multiple Choice)
4.8/5 (34)
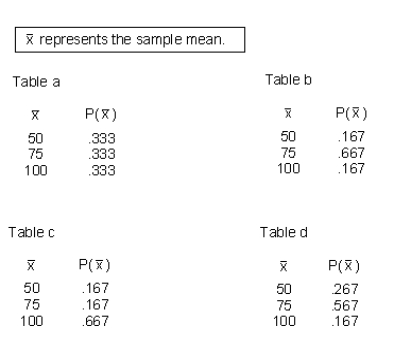
Flagg and Rossi own a fleet of limos.The current odometer readings for the limos are shown in the table below:  Suppose you were to take all possible simple random samples of size 2 that could be selected from this limo population and calculated the sample mean odometer reading for each sample.Which one of the following tables shows the sampling distribution of the sample mean?
(Multiple Choice)
4.7/5 (40)
Which of the following factors would be used to determine sample size?
(Multiple Choice)
4.9/5 (32)
Before any order is shipped, inspectors at Alvarez Manufacturing test a sample of finished units for breaking strength.You select a simple random sample of units from a recently completed order and find that the sample average breaking strength is 814 pounds.From the sample selected, you construct a 95% confidence interval estimate of the average breaking strength you could expect to find if all the units in the order were tested.The interval turns out to be 814 ± 7.5 lbs.How would you interpret your result?
(Multiple Choice)
4.8/5 (26)
Filters
- Essay(0)
- Multiple Choice(0)
- Short Answer(0)
- True False(0)
- Matching(0)