Exam 2: Descriptive Statistics I: Elementary Data Presentation and Description
Exam 1: An Introduction to Statistics44 Questions
Exam 2: Descriptive Statistics I: Elementary Data Presentation and Description147 Questions
Exam 3: Descriptive Statistics II: Additional Descriptive Measures and Data Displays128 Questions
Exam 4: Probability147 Questions
Exam 5: Discrete Probability Distributions144 Questions
Exam 6: Continuous Probability Distributions141 Questions
Exam 7: Statistical Inference: Estimating a Population Mean134 Questions
Exam 8: Interval Estimates for Proportions, Mean Differences and Proportion Differences19 Questions
Exam 9: Statistical Hypothesis Testing: Hypothesis Tests for a Population Mean62 Questions
Exam 10: Hypothesis Tests for Proportions, Mean Differences and Proportion Differences39 Questions
Exam 11: Basic Regression Analysis111 Questions
Exam 12: Multiple Regression53 Questions
Exam 13: F Tests and Analysis of Variance95 Questions
Exam 14: Experimental Designonline Only64 Questions
Exam 16: Chi-Square Tests145 Questions
Select questions type
The closing share price for G.E.stock over the past seven days is shown below.Compute the standard deviation for the data.Treat the data as a population. 112, 115, 111, 116, 116, 116, 112
Free
(Multiple Choice)
5.0/5  (30)
(30)
Correct Answer: Verified
B
If a data set has an even number of observations, then the median:
Free
(Multiple Choice)
4.7/5 (39)
Correct Answer:Verified
B
Carnival Cruise Lines reported the number of passengers (in millions) it served for the past 8 years.Compute the range for the data. 
Free
(Multiple Choice)
4.7/5 (34)
Correct Answer:Verified
E
Atlantic Power and Light tracked daily power surges over the last 500 days.Results are reported in the relative frequency table below.Compute the standard deviation for the daily power surge data. 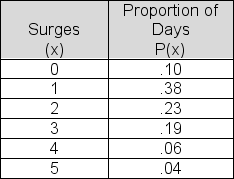
(Multiple Choice)
4.9/5 (35)
In computing descriptive statistics from grouped data, the midpoint of each interval is treated as a representative value for all of the group members.
(True/False)
4.9/5 (34)
A descriptive measure that is NOT measured in the same units as the original data is the variance.
(True/False)
4.9/5 (39)
Below is a list of shipping costs quoted by six online retailers for the same item.Compute the average shipping cost. $3.00 $2.84 $2.40 $3.02 $2.80 $2.51
(Multiple Choice)
4.9/5 (42)
The table shows the life expectancy in years of the G8 countries (Datablog, Guardian.co.uk, July 8 2009).Treating the data as a population, what is the mean absolute deviation of life expectancy in the eight countries, in years? 
(Multiple Choice)
4.8/5 (32)
Below is a frequency table showing the results of a recent customer survey done at the Mall of America in Minneapolis.Fifty shoppers were asked, "How many times did you visit the Mall last month to shop?" Determine the "less than or equal to" cumulative frequency that would be appropriate for an x value of 2 mall visits. 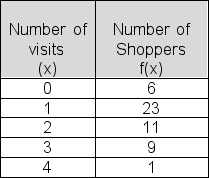
(Multiple Choice)
4.9/5 (37)
A data set contains only two values.The larger of the two values is 25.If the range is 12, what is the median value in the data set?
(Multiple Choice)
4.8/5 (37)
Which of the following is an accurate interpretation of the standard deviation of a population?
(Multiple Choice)
4.8/5 (33)
The age distribution of consumers who identify themselves as "frequent users" of the Internet to make purchases is shown in the table.Estimate the mean age of these frequent users. 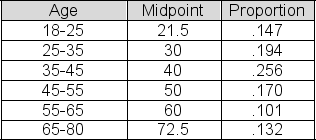
(Multiple Choice)
4.9/5 (39)
For a sample of 10 days, Harkin Research recorded the number of visitors to Tilton.com's website.Determine the mode for the data. 100, 100, 106, 93, 89, 95, 97, 181, 99, 100
(Multiple Choice)
4.7/5 (38)
The main difference between a bar chart and a histogram is that the bars are separated in a bar chart to emphasize the fact that each class/value is a separate category/discrete value.
(True/False)
4.9/5 (29)
The number of US solar energy companies that applied for special tax credits in each of the past 11 months, according to a recent study, is shown below.Determine the median for the data. 14, 17, 12, 11, 17, 20, 11, 12, 15, 17, 20
(Multiple Choice)
4.8/5 (41)
In a recent survey, 75 college students were asked how many e-textbooks they are using this term.Survey results are as follows.Compute the standard deviation for the number of e-textbooks in use by students in the survey.Treat the data as a population. 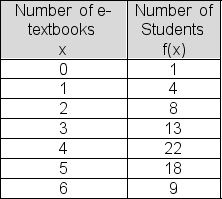
(Multiple Choice)
4.8/5 (33)
Turcott Roof and Deck has 130 jobs scheduled for the upcoming month.The following frequency table shows the estimated time for each of the jobs.Compute the variance for the estimated completion time data.Treat the data as a population. 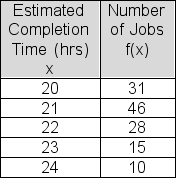
(Multiple Choice)
4.9/5 (37)
The degree to which a data distribution has one extended "tail" showing either unusually large or unusually small values is called:
(Multiple Choice)
5.0/5 (39)
Below is a frequency table showing the number of new restaurants opened in the city over the past 24 months.Compute the standard deviation of the number of openings data.Treat the data as a population. 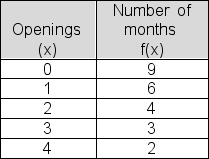
(Multiple Choice)
4.8/5 (38)
Filters
- Essay(0)
- Multiple Choice(0)
- Short Answer(0)
- True False(0)
- Matching(0)