Exam 2: Basic Descriptive Statistics Percentages, Ratios Rates, Tables, Charts Graphs
Exam 1: Introduction47 Questions
Exam 2: Basic Descriptive Statistics Percentages, Ratios Rates, Tables, Charts Graphs48 Questions
Exam 3: Measures of Central Tendency48 Questions
Exam 4: Measures of Dispersion39 Questions
Exam 5: The Normal Curve42 Questions
Exam 6: Introduction to Inferential Statistics Sampling the Sampling Distribution57 Questions
Exam 7: Hypothesis Testing I the One-Sample Case51 Questions
Exam 8: Hypothesis Testing II the Two-Sample Case49 Questions
Exam 9: Hypothesis Testing III: the Analysis of Variance48 Questions
Exam 10: Hypothesis Testing Iv Chi Square45 Questions
Exam 11: Bivariate Association for Nominal- and Ordinal-Level Variables74 Questions
Exam 12: Association Between Variables Measured at the Interval-Ratio Level45 Questions
Exam 13: Partial Correlation and48 Questions
Select questions type
A possible problem with open-ended or unequal intervals is that they
Free
(Multiple Choice)
4.8/5  (26)
(26)
Correct Answer: Verified
A
According to the report discussed in the text, about what percentage of high school students have used cigarettes, alcohol, marijuana, or cocaine at least once?
Free
(Multiple Choice)
4.8/5 (41)
Correct Answer:Verified
B
Histograms and line charts or frequency polygons are used with data measured at the
Free
(Multiple Choice)
4.9/5 (32)
Correct Answer:Verified
C
For a single variable at the interval-ratio level, an appropriate graph would be
(Multiple Choice)
4.9/5 (28)
When working with a very small number of cases, it is usually preferable to report
(Multiple Choice)
4.8/5 (41)
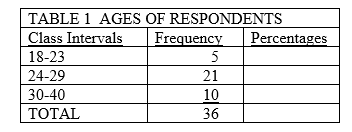 -In Table 1, what percentage of cases is in the 18-23 age group?
(Multiple Choice)
4.9/5 (35)
To calculate a proportion, the number of cases in any category (f) is divided by
(Multiple Choice)
4.8/5 (33)
According to information presented in the text, the US divorce rate
(Multiple Choice)
4.9/5 (34)
The sum of the proportions for all categories of a variable will be
(Multiple Choice)
4.9/5 (33)
Frequency distributions may be compiled for variables measured at which level?
(Multiple Choice)
4.8/5 (33)
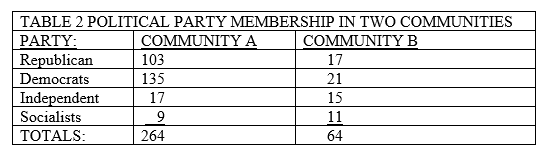 -In Table 2, which is the correct fraction for determining the proportion of Independents in community B?
(Multiple Choice)
4.8/5 (36)
The crude birth rate of a city that has 250 births in a year and a population of 7500 would be found by using which of the following?
(Multiple Choice)
4.9/5 (28)
If 60 cases range in score from 4 to 84 and you want 10 intervals in a frequency distribution, approximately what will be the width of each interval?
(Multiple Choice)
4.9/5 (35)
A city of 1567 people had 34 auto thefts last year. The auto theft rate for this city
(Multiple Choice)
4.8/5 (43)
-In Table 2, which community has the higher proportion of Independents?
(Multiple Choice)
4.9/5 (38)
Forty of every two hundred students attend all of their classes. What percentage of the student body is this?
(Multiple Choice)
4.8/5 (22)
-In Table 2, what is the ratio of Independents to Socialists in Community A?
(Multiple Choice)
4.9/5 (23)
In reading SPSS output for the Frequencies procedure, we usually ignore the 'Percent' column because it
(Multiple Choice)
4.8/5 (40)
-In Table 2, what is the ratio of Socialists to Democrats in Community B?
(Multiple Choice)
4.8/5 (40)
Filters
- Essay(0)
- Multiple Choice(0)
- Short Answer(0)
- True False(0)
- Matching(0)