Exam 7: Continuous Probability Distributions
Exam 1: Why Study Statistics11 Questions
Exam 2: An Introduction to Statistics and Statistical Inference53 Questions
Exam 3: Tables and Graphs for Summarizing Data28 Questions
Exam 4: Numerical Summary Measures34 Questions
Exam 5: Probability54 Questions
Exam 6: Random Variables and Discrete Probability Distributions23 Questions
Exam 7: Continuous Probability Distributions45 Questions
Exam 8: Sampling Distributions50 Questions
Exam 9: Confidence Intervals Based on a Single Sample51 Questions
Exam 10: Hypothesis Tests Based on a Single Sample65 Questions
Exam 11: Confidence Intervals and Hypothesis Tests Based on Two Samples or Treatments45 Questions
Exam 12: The Analysis of Variance12 Questions
Exam 13: Correlation and Linear Regression57 Questions
Exam 14: Categorical Data and Frequency Tables23 Questions
Exam 15: Nonparametric Statistics66 Questions
Select questions type
Assume Z is a standard normal random variable with P(-z < Z < z) = 0.8764.What is z?
Free
(Multiple Choice)
5.0/5  (39)
(39)
Correct Answer: Verified
C
The return on investment for a particular security has historically followed a normal distribution with a mean profit of 4.75% and standard deviation of 1.5%.If the historical pattern holds, what is the probability of investing in this security and seeing greater than a 6% return?
Free
(Multiple Choice)
4.9/5 (34)
Correct Answer:Verified
C
Which of the following statements is true with regard to continuous random variables?
Free
(Multiple Choice)
4.8/5 (33)
Correct Answer:Verified
C
Suppose the cumulative distribution function (CDF) of continuous random variable X is defined as follows: 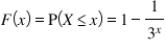 where x ≥ 0.What is P(X > 1.25)?
(Multiple Choice)
4.9/5 (31)
For any continuous random variable X, if both a and b are fixed real numbers such that a < b, then P(a ≤ X ≤ b) will always be:
(Multiple Choice)
4.8/5 (35)
Large electrical generation companies use so-called peaking generators to carry additional load when demand for electrical power is particularly high.Running these generators at very low loads is bad for them for a number of reasons.A particular peaking generator carries an average load of 20 MW, with standard deviation of 4.23 MW.If this generator's low load threshold is 10 MW, what percentage of time is this generator being run at a low load condition?
(Multiple Choice)
4.9/5 (40)
The descriptive statistics for the age differences (husband age - wife age) from a sample of 100 married couples are shown here.  Based on these statistics, do the data appear to be normally distributed?
(Multiple Choice)
4.8/5 (30)
Heights of children entering kindergarten are normally distributed with a mean height of 103 cm and a standard deviation of 1.27 cm.Sixty-seven percent of the children entering kindergarten are taller than:
(Multiple Choice)
4.8/5 (42)
A child psychologist believes that the results from a standardized behavior test fail to hold to the assumption of normality.She samples 250 results from the test to evaluate normality.The average value of the 250 samples is 105.25, with a standard deviation of 21.2.She finds that 30% of the scores are greater than 168.What conclusion should she draw based solely on this finding?
(Multiple Choice)
4.8/5 (29)
Which of the following statements is true with regard to continuous random variables?
(Multiple Choice)
4.8/5 (30)
A sample of recorded dog barks is analyzed for decibel intensity.The mean intensity is 62.25 decibels, with a variance of 4.45.If this data set is normally distributed, we would expect approximately 95% of the barks to be within what range?
(Multiple Choice)
4.9/5 (37)
Most production model hybrid cars use a large battery as the core component of their power system.The battery lifetime of a particular hybrid are follows an exponential distribution with a mean lifetime of 8.62 years.What is the probability that one of these hybrid cars will have a battery that will last between 8 and 10 years?
(Multiple Choice)
4.8/5 (36)
Seismologists have discovered a thermal disturbance in a remote location near the polar ice caps.Since the disturbance appears to occur randomly, they model the event using an exponential random variable X.If the mean time between occurrences is 52.25 hours, what is the probability that there will be at least 24 hours between occurrences?
(Multiple Choice)
4.8/5 (38)
Variable N N* Mean SE Mean StDev Minimum Q1 Median Q3 C4 150 0 64.940 0.0825 1.010 62.722 65.679
Variable Maximum
C4 67.445
If this data set were normal, which value would most likely fall into the first quartile?
(Multiple Choice)
4.8/5 (30)
The Minitab descriptive statistics display from a data set is shown here:
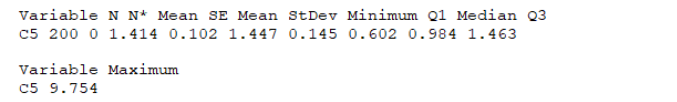 Using the IQR/s criteria, do these data appear to be normally distributed?
(Multiple Choice)
4.8/5 (33)
If X is a normal random variable with mean μ, standard deviation 0.15, and P(X < 2.10) = 0.025, what is the value of μ?
(Multiple Choice)
4.9/5 (32)
Let X = the time (in minutes) that a postal clerk spends with her customers.This time is known to have an exponential distribution with an average of 4 minutes.What is the parameter λ for this random variable?
(Multiple Choice)
4.8/5 (32)
Any distribution whose mean value is equal to the median with first and third quartiles equidistant from them both is:
(Multiple Choice)
4.9/5 (32)
What differentiates the standard normal distribution (Z) from any other arbitrary normal distribution?
(Multiple Choice)
4.8/5 (41)
Filters
- Essay(0)
- Multiple Choice(0)
- Short Answer(0)
- True False(0)
- Matching(0)