Exam 13: Correlation and Linear Regression
Exam 1: Why Study Statistics11 Questions
Exam 2: An Introduction to Statistics and Statistical Inference53 Questions
Exam 3: Tables and Graphs for Summarizing Data28 Questions
Exam 4: Numerical Summary Measures34 Questions
Exam 5: Probability54 Questions
Exam 6: Random Variables and Discrete Probability Distributions23 Questions
Exam 7: Continuous Probability Distributions45 Questions
Exam 8: Sampling Distributions50 Questions
Exam 9: Confidence Intervals Based on a Single Sample51 Questions
Exam 10: Hypothesis Tests Based on a Single Sample65 Questions
Exam 11: Confidence Intervals and Hypothesis Tests Based on Two Samples or Treatments45 Questions
Exam 12: The Analysis of Variance12 Questions
Exam 13: Correlation and Linear Regression57 Questions
Exam 14: Categorical Data and Frequency Tables23 Questions
Exam 15: Nonparametric Statistics66 Questions
Select questions type
In the late 1890s, scientists first noted that the frequency of a cricket's chirps is related to air temperature.For each of 30 crickets, the frequency of chirping (in chirps per minute) and the air temperature (in degrees Fahrenheit) were recorded, and a regression analysis was performed.
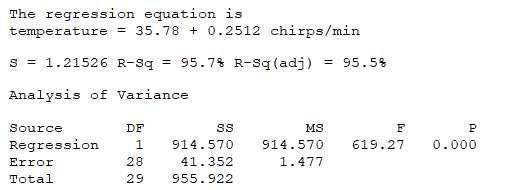
Given that Sxx= 14,497.9 and
Given that Sxx= 14,497.9 and  067, what is a 90% prediction interval for the air temperature when a cricket is chirping at a frequency of 120 chirps per minute?
Free
(Multiple Choice)
4.8/5  (43)
(43)
Correct Answer: Verified
B
In simple linear regression, most often we perform a two-tailed test of the population slope  to determine whether there is sufficient evidence to infer that a linear relationship exists.The null hypothesis is stated as:
Free
(Multiple Choice)
4.7/5 (27)
Correct Answer:Verified
A
An instructor's records show a 0.956 correlation between grades and attendance.If the correlation implies causality, what might this imply?
Free
(Multiple Choice)
4.9/5 (32)
Correct Answer:Verified
B
In a simple linear regression, if the coefficient of determination is 0.94, then:
(Multiple Choice)
4.9/5 (34)
The linear regression model assumes the error random variable is:
(Multiple Choice)
4.9/5 (43)
In the linear regression model, the homogeneity of variance assumption basically means:
(Multiple Choice)
4.7/5 (30)
The confidence interval estimate of the expected value of y for a given value of x, when compared to the prediction interval of y for the same given value of x at the same confidence level, will be:
(Multiple Choice)
4.9/5 (26)
According to the spurious correlations website (https://www.tylervigen.com/spurious-correlations), there is a 0.952407 correlation from 1999 to 2010 between people who drowned after falling from a fishing boat and the marriage rate in Kentucky.This shows that:
(Multiple Choice)
4.7/5 (28)
If the sample correlation coefficient is -0.95, what can we conclude?
(Multiple Choice)
4.8/5 (31)
We record the amount of time (x in minutes) per day that a group of 12 high school students spend using their cell phone (texting, talking, and web use).We also record the overall GPA (y) of each student.Following a regression summary for these data:
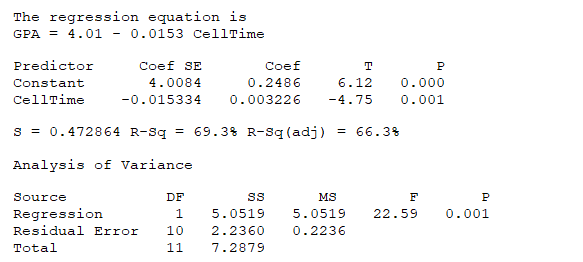
Does there appear to be a significant linear relationship between the amount of cell phone use and GPA? (Use α = 0.01.)
Does there appear to be a significant linear relationship between the amount of cell phone use and GPA? (Use α = 0.01.)
(Multiple Choice)
4.8/5 (33)
Given a specific value of x and a confidence level, which of the following statements is correct?
(Multiple Choice)
4.8/5 (31)
We record the amount of time (x in minutes) per day that a group of 12 high school students spend using their cell phone (texting, talking, and web use).We also record the overall GPA (y) of each student.Following is a regression summary for these data:
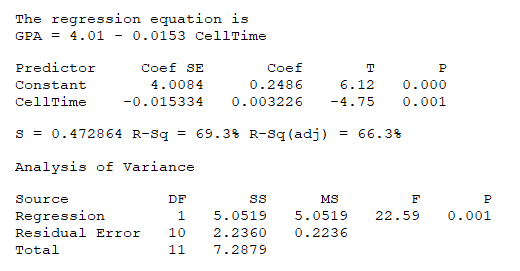
What is a 95% confidence interval for the average GPA change associated with a 1-min increase in average daily cell use (β1)?
What is a 95% confidence interval for the average GPA change associated with a 1-min increase in average daily cell use (β1)?
(Multiple Choice)
4.8/5 (34)
The statement that "correlation does not imply causality" indicates that:
(Multiple Choice)
4.9/5 (36)
In simple linear regression, the plot of residuals versus fitted values should:
(Multiple Choice)
4.7/5 (29)
From the following residual versus fit plot, it appears that: 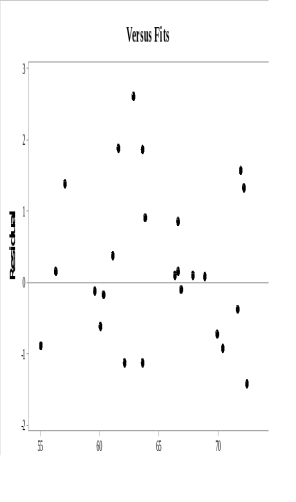
(Multiple Choice)
4.8/5 (30)
The following ANOVA table describes a simple linear regression on two arbitrary variables x and y.
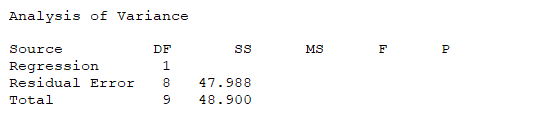
Based on the output, does there appear to be a significant linear relationship between x and y? Select the appropriate critical value (CV), test statistic (TS), and decision.(Use α = 0.01.)
Based on the output, does there appear to be a significant linear relationship between x and y? Select the appropriate critical value (CV), test statistic (TS), and decision.(Use α = 0.01.)
(Multiple Choice)
4.8/5 (39)
Ten used cars from a rental fleet are randomly selected.Each vehicle's annual maintenance cost from the previous calendar year (y) is recorded as well as the vehicle's current mileage (x).A simple linear regression is conducted on the data.
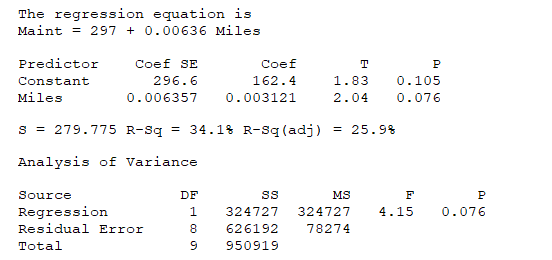 What is an 80% prediction interval for the annual repair cost of a used vehicle with 40,000 miles? (Given: Sxx= 8,036,677,024 and
  = $43,627.700.)
(Multiple Choice)
4.8/5 (33)
If the sum of squares for error (SSE) is equal to zero, then the coefficient of determination, r2, must be:
(Multiple Choice)
4.8/5 (35)
Filters
- Essay(0)
- Multiple Choice(0)
- Short Answer(0)
- True False(0)
- Matching(0)