Exam 11: Confidence Intervals and Hypothesis Tests Based on Two Samples or Treatments
Exam 1: Why Study Statistics11 Questions
Exam 2: An Introduction to Statistics and Statistical Inference53 Questions
Exam 3: Tables and Graphs for Summarizing Data28 Questions
Exam 4: Numerical Summary Measures34 Questions
Exam 5: Probability54 Questions
Exam 6: Random Variables and Discrete Probability Distributions23 Questions
Exam 7: Continuous Probability Distributions45 Questions
Exam 8: Sampling Distributions50 Questions
Exam 9: Confidence Intervals Based on a Single Sample51 Questions
Exam 10: Hypothesis Tests Based on a Single Sample65 Questions
Exam 11: Confidence Intervals and Hypothesis Tests Based on Two Samples or Treatments45 Questions
Exam 12: The Analysis of Variance12 Questions
Exam 13: Correlation and Linear Regression57 Questions
Exam 14: Categorical Data and Frequency Tables23 Questions
Exam 15: Nonparametric Statistics66 Questions
Select questions type
A psychologist is studying the effect of belly stars on Sneetches.A random sample of four Sneetches is drawn, and a test of self-image is given to each Sneetch before and after having the belly star status changed.(If the Sneetch initially had a star, it was removed; if it did not have a star, one was created on the Sneetch using the patented "Star-off/Star-on" procedure.) From the following sample data, does it appear that changing belly star status increases the average self-image of Sneetches? Select the appropriate critical value (CV), test statistic (TS), and decision.(Use α = 0.10). 
Free
(Multiple Choice)
4.8/5  (30)
(30)
Correct Answer: Verified
A
The sampling distribution of the ratio of two sample variances is said to follow an F distribution provided that:
Free
(Multiple Choice)
4.8/5 (31)
Correct Answer:Verified
A
Two methods for precisely estimating the weights of very large objects are being evaluated for consistency.From 9 measurements using method 1, there is a variance of 1.023; from 14 measurements using method 2, there is a variance of 0.095.Does method 1 appear to have more variability than method 2? Select the appropriate critical value (CV), test statistic (TS), and decision and state the null hypothesis.(Use α = 0.05).
Free
(Multiple Choice)
4.9/5 (33)
Correct Answer:Verified
A
If you wish to test whether two population means are equal using a two-sample t test with a pooled estimate of the common variance, which of the following assumptions is NOT true?
(Multiple Choice)
4.9/5 (36)
To study the effect of soothing music on a person's blood pressure, two random groups of 220 adults were drawn.One group (sample 1) listened to soothing music for 5 min prior to having their blood pressure taken, while the other group (sample 2) sat in silence.From previous studies, it was found that both populations have a standard deviation of 39.18.The average systolic blood pressure from the music group was 114.5.The average systolic blood pressure from the silence group was 122.8.Does the experiment support the conclusion that soothing music significantly lowers average systolic blood pressure better than silence? Select the correct p-value and decision and state the null hypothesis.Use α = 0.01.
(Multiple Choice)
4.8/5 (44)
Concerning inference on two independent population means, the pooled variance estimate is:
(Multiple Choice)
4.9/5 (28)
The test statistic 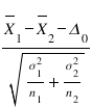
Follows a standard normal distribution if:
Follows a standard normal distribution if:
(Multiple Choice)
4.9/5 (35)
Construct a 98% confidence interval on the ratio of population variances based on the following samples from two normally distributed populations. 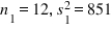
(Multiple Choice)
4.8/5 (41)
Two cosmetics manufacturers produce similar hairspray products.Manufacturer 1 asserts that its hairspray holds longer, on average, than does its competitor's product.To test the claim, we randomly sample 20 hairspray users and have half of them use brand 1 hairspray while the other half use brand 2.The average hold time for brand 1 is 18.5 hr with a standard deviation of 6.28 hr.The average hold time for brand 2 is 17.95 hr with a standard deviation of 8.55 hr.Does the sample support manufacturer 1's assertion? Assume that the populations in question are both normal and have unequal variances.Select the appropriate critical value (CV), test statistic (TS), decision and conclusion.(Use α = 0.10).
(Multiple Choice)
4.8/5 (41)
A recent survey of pet owners found that 53% of 100 randomly selected cat owners (population 1) and 63% of 100 independently, randomly selected dog owners (population 2) said they would perform cardiopulmonary resuscitation (CPR) on their pets in the event of a medical emergency.Determine a 95% confidence interval for the difference in the population proportion of pet owners who would provide CPR on their pet in the event of an emergency.
(Multiple Choice)
4.7/5 (26)
The estimator  is unbiased for the parameter
  .This means that:
(Multiple Choice)
4.8/5 (32)
Which of the following options would serve as an intuitive estimate of the parameter  ?
?
(Multiple Choice)
4.7/5 (37)
Two hospitals share responsibility for a very poor area of a major city.Both are required to treat patients regardless of their ability to pay.Hospital 1 claims that its emergency room (ER) treats a higher percentage of nonpaying patients than does hospital 2.In a random sample of 200 ER cases from hospital 1, 122 were unable to pay.An independent sample of 180 ER cases from hospital 2 has 108 that were unable to pay.Construct a 99% confidence interval for the population difference in the proportions of nonpaying patients.
(Multiple Choice)
4.8/5 (41)
Suppose you want to use a paired t test to determine if the population means of before-and-after measurements are different, and you plan to use samples of size 45.What number of degrees of freedom should you use?
(Multiple Choice)
4.8/5 (30)
In 1993, Toyota introduced the Supra sports car, which was designed to have 320 horsepower in stock configuration.A computer chip modification for the fuel injection system was later introduced that was claimed to increase horsepower.To check whether the chip actually does increase horsepower, we sample six stock 1993 Supras and record each vehicle's horsepower (the results appear below). 
Next, technicians install the computer chip in each of the six vehicles' electronic injection systems and then record the horsepower of each (the results appear below).
Next, technicians install the computer chip in each of the six vehicles' electronic injection systems and then record the horsepower of each (the results appear below).

Find a 95% confidence interval on the population mean horsepower difference associated with the chip modification.
Find a 95% confidence interval on the population mean horsepower difference associated with the chip modification.
(Multiple Choice)
4.7/5 (30)
If you wish to estimate the difference between two population means and the population variances are known, a 99% confidence interval estimate can be found by using which of the following critical values?
(Multiple Choice)
4.8/5 (31)
Hypothesis testing on two means from dependent samples cannot be conducted using the same methods appropriate for independent sample analysis.The main reason for this is because:
(Multiple Choice)
4.9/5 (33)
Concerning the statement of the null hypothesis, 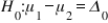 ,
,  is always:
(Multiple Choice)
4.9/5 (33)
A researcher wants to know if students who do not plan to apply for financial aid have more variability on the SAT math test than those who do.Random samples of 25 students who do not plan to apply for aid (sample 1) as well as 30 who do (sample 2) are summarized below: 
Does it appear that students who do not plan to apply for financial aid are less consistent on the SAT math test than those who do plan to apply for aid? Select the appropriate critical value (CV), test statistic (TS), and decision and state the alternative hypothesis.(Use α = 0.01).
Does it appear that students who do not plan to apply for financial aid are less consistent on the SAT math test than those who do plan to apply for aid? Select the appropriate critical value (CV), test statistic (TS), and decision and state the alternative hypothesis.(Use α = 0.01).
(Multiple Choice)
4.9/5 (31)
In developing a confidence interval estimate for the difference between two population means when the population variances are known, a decrease in the difference  will result in:
(Multiple Choice)
4.9/5 (31)
Filters
- Essay(0)
- Multiple Choice(0)
- Short Answer(0)
- True False(0)
- Matching(0)