Exam 3: Tables and Graphs for Summarizing Data
Exam 1: Why Study Statistics11 Questions
Exam 2: An Introduction to Statistics and Statistical Inference53 Questions
Exam 3: Tables and Graphs for Summarizing Data28 Questions
Exam 4: Numerical Summary Measures34 Questions
Exam 5: Probability54 Questions
Exam 6: Random Variables and Discrete Probability Distributions23 Questions
Exam 7: Continuous Probability Distributions45 Questions
Exam 8: Sampling Distributions50 Questions
Exam 9: Confidence Intervals Based on a Single Sample51 Questions
Exam 10: Hypothesis Tests Based on a Single Sample65 Questions
Exam 11: Confidence Intervals and Hypothesis Tests Based on Two Samples or Treatments45 Questions
Exam 12: The Analysis of Variance12 Questions
Exam 13: Correlation and Linear Regression57 Questions
Exam 14: Categorical Data and Frequency Tables23 Questions
Exam 15: Nonparametric Statistics66 Questions
Select questions type
This table summarizes the responses to a nationwide telephone survey conducted by the Pew Foundation in October 2010.U.S.adults ages 18 and older were asked, "Some people say there is only one true love for each person.Do you agree or disagree?" Some of the table values are purposely missing.What was the frequency of the "Don't Know" responses? 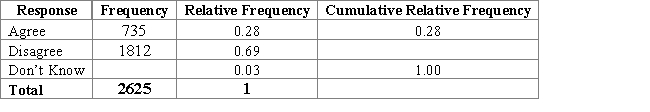
Free
(Multiple Choice)
4.7/5  (30)
(30)
Correct Answer: Verified
A
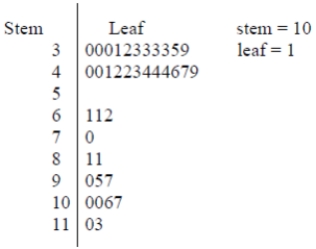
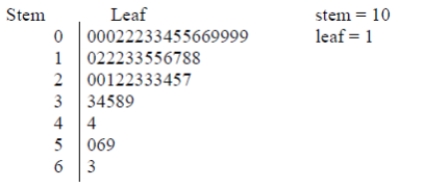 This stem-and-leaf plot shows the lengths of reigns (in years) of the British monarchs.The shape of this plot is best described as:
Free
(Multiple Choice)
4.8/5 (35)
Correct Answer:Verified
D
A particular advantage of a stem-and-leaf plot over a histogram or bar chart is that:
Free
(Multiple Choice)
4.8/5 (36)
Correct Answer:Verified
B
Two statistics students are arguing over which type of bar graph to use.One insists that a bar graph that displays the relative frequency will be better for displaying the overall shape of the data.The other holds that only a frequency bar graph will suffice.You happen along and hear their conversation.What advice do you give them?
(Multiple Choice)
4.9/5 (36)
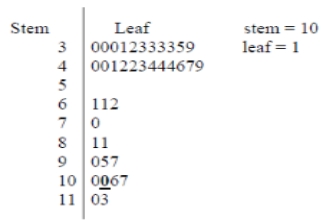
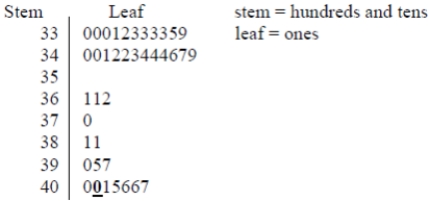 What data value is represented by the bold and underlined "0" in the stem-and-leaf diagram? (Note: It is bold and underlined for emphasis only.)
(Multiple Choice)
4.9/5 (38)
 Judging from this stem-and-leaf display, the data set appears to be:
(Multiple Choice)
4.8/5 (28)
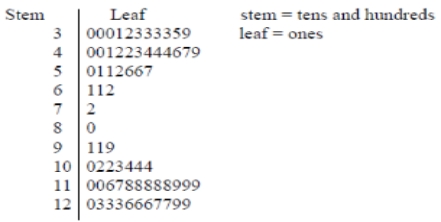
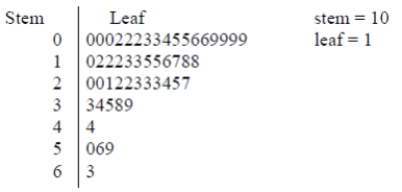
 What is the value of the data point represented by the bold and underlined "0" in the stem-and-leaf diagram? (Note: It is bold and underlined for emphasis only.)
(Multiple Choice)
5.0/5 (38)
 This stem-and-leaf plot shows the lengths of reigns (in years) of the British monarchs.According to the plot, how many British rulers had reigns that lasted less than a full year?
(Multiple Choice)
4.9/5 (26)
Relative frequency is best suited to describing __________________ data.
(Multiple Choice)
5.0/5 (33)
 This stem-and-leaf plot shows the lengths of reigns (in years) of the British monarchs.According to the plot, how many British rulers had reigns that lasted 32 years?
(Multiple Choice)
4.9/5 (37)
A student counted the number of candies of each color in a bag of 57 Reese's Pieces.The results are shown in the bar graph.  How many of the candies were colored orange?
(Multiple Choice)
4.8/5 (35)
 The shape of the data set summarized in the stem-and-leaf diagram is best described as:
(Multiple Choice)
5.0/5 (30)
A student counted the number of candies of each color in a bag of 57 Reese's Pieces.The results are shown in the bar graph. 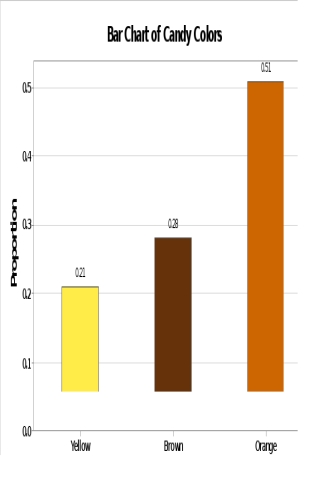 What percentage of the candies were not colored orange?
(Multiple Choice)
4.9/5 (29)
A numeric data set is __________________ if the set of all possible values is any number within an interval of numbers.
(Multiple Choice)
4.8/5 (29)
Concerning qualitative data, the ______________ of a particular class is the frequency of the class divided by the total number of observations.
(Multiple Choice)
4.9/5 (40)
If there are more than two observations on the same person, the data set is:
(Multiple Choice)
4.9/5 (35)
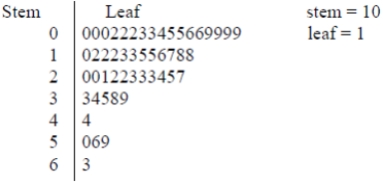
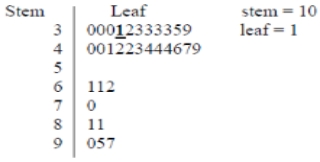 What data value is represented by the bold and underlined "1" in the stem-and-leaf diagram? (Note: It is bold and underlined for emphasis only.)
(Multiple Choice)
4.8/5 (27)
A numerical data set is ___________ if the set of all possible values is finite, or countably infinite.
(Multiple Choice)
5.0/5 (45)
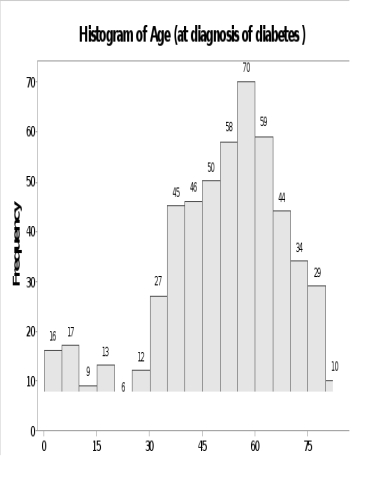 This histogram shows the age at which 548 patients were first diagnosed with diabetes.The shape of this histogram is best described as:
(Multiple Choice)
4.9/5 (38)
Concerning qualitative data, the _____________ of a particular class is the count for that class.
(Multiple Choice)
5.0/5 (27)
Filters
- Essay(0)
- Multiple Choice(0)
- Short Answer(0)
- True False(0)
- Matching(0)