Exam 4: Basic Probability
Exam 1: Introduction118 Questions
Exam 2: Organizing and Visualizing Data210 Questions
Exam 3: Numerical Descriptive Measures143 Questions
Exam 4: Basic Probability171 Questions
Exam 5: Discrete Probability Distributions137 Questions
Exam 6: The Normal Distribution145 Questions
Exam 7: Sampling and Sampling Distributions197 Questions
Exam 8: Confidence Interval Estimation185 Questions
Exam 9: Fundamentals of Hypothesis Testing: One-Sample Tests168 Questions
Exam 10: Two-Sample Tests and One-Way ANOVA293 Questions
Exam 11: Chi-Square Tests108 Questions
Exam 12: Simple Linear Regression213 Questions
Exam 13: Introduction to Multiple Regression291 Questions
Exam 14: Statistical Applications in Quality Management107 Questions
Select questions type
TABLE 4-10
Are whites more likely to claim bias? It was found that 60% of the workers were white, 30% were black and 10% were other races. Given that a worker was white, the probability that the worker had claimed bias was 30%. Given that a worker was black, the probability that the worker had claimed bias was 40%. Given that a worker was other race, the probability that the worker had claimed bias was 0%.
-Referring to Table 4-10, if a randomly selected worker had not claimed bias, what is the probability that the worker is white?
(Short Answer)
4.9/5  (37)
(37)
TABLE 4-8
According to the record of the registrar's office at a state university, 35% of the students are freshman, 25% are sophomore, 16% are junior, and the rest are senior. Among the freshmen, sophomores, juniors, and seniors, the portion of students who live in the dormitory are, respectively, 80%, 60%, 30%, and 20%.
-Referring to Table 4-8, what is the probability that a randomly selected student is a junior or senior who lives in a dormitory?
(Short Answer)
4.9/5 (41)
TABLE 4-4
Suppose that patrons of a restaurant were asked whether they preferred water or whether they preferred soda. 70% said that they preferred water. 60% of the patrons were male. 80% of the males preferred water.
-Referring to Table 4-4, the probability a randomly selected patron prefers soda is ________.
(Short Answer)
4.8/5 (43)
A company has two machines that produce widgets. An older machine produces 23% defective widgets, while the new machine produces only 8% defective widgets. In addition, the new machine produces three times as many widgets as the older machine does. What is the probability that a randomly chosen widget produced by the company is defective?
(Multiple Choice)
4.8/5 (28)
A survey of banks revealed the following distribution for the interest rate being charged on a home loan (based on a 30-year mortgage with a 10% down payment).
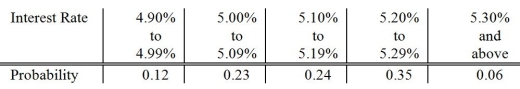 If a bank is selected at random from this distribution, what is the chance that the interest rate charged on a home loan will exceed 5.19%?
(Multiple Choice)
4.7/5 (41)
An investment consultant is recommending a certain class of mutual funds to clients based on its exceptionally high probability of gain. It is an ethical practice to explain to clients what the meaning of probability is.
(True/False)
4.9/5 (33)
TABLE 4-11
A sample of 300 adults is selected. The contingency table below shows their registration status and their preferred source of information on current events.
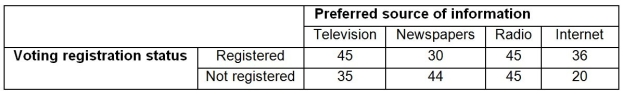 -Referring to Table 4-11, if an adult is selected at random, what is the probability that he/she is a not a registered voter or does not prefer to get his/her current information from the Internet?
(Short Answer)
4.8/5 (35)
TABLE 4-10
Are whites more likely to claim bias? It was found that 60% of the workers were white, 30% were black and 10% were other races. Given that a worker was white, the probability that the worker had claimed bias was 30%. Given that a worker was black, the probability that the worker had claimed bias was 40%. Given that a worker was other race, the probability that the worker had claimed bias was 0%.
-Referring to Table 4-10, what is the probability that a randomly selected worker had not claimed bias?
(Short Answer)
4.8/5 (45)
According to a survey of American households, the probability that the residents own two cars if annual household income is over $50,000 is 80%. Of the households surveyed, 60% had incomes over $50,000 and 70% had two cars. The probability that annual household income is over $50,000 if the residents of a household own two cars is ________.
(Multiple Choice)
4.8/5 (37)
TABLE 4-6
At a Texas college, 60% of the students are from the southern part of the state, 30% are from the northern part of the state, and the remaining 10% are from out-of-state. All students must take and pass an Entry Level Math (ELM) test. 60% of the southerners have passed the ELM, 70% of the northerners have passed the ELM, and 90% of the out-of-staters have passed the ELM.
-Referring to Table 4-6, the probability that a randomly selected student is someone from northern Texas who has not passed the ELM is ________.
(Short Answer)
4.9/5 (43)
TABLE 4-3
A survey is taken among customers of a fast-food restaurant to determine their preference for hamburger or chicken. Of 200 respondents selected, 75 were children and 125 were adults. 120 preferred hamburger and 80 preferred chicken. 55 of the children preferred hamburger.
-Referring to Table 4-3, assume we know the person is a child. The probability that this individual prefers hamburger is ________.
(Short Answer)
4.9/5 (37)
According to a survey of American households, the probability that the residents own two cars if annual household income is over $50,000 is 80%. Of the households surveyed, 60% had incomes over $50,000 and 70% had two cars. The probability that the residents do not own two cars if annual household income is not over $50,000 is ________.
(Multiple Choice)
4.8/5 (32)
TABLE 4-3
A survey is taken among customers of a fast-food restaurant to determine their preference for hamburger or chicken. Of 200 respondents selected, 75 were children and 125 were adults. 120 preferred hamburger and 80 preferred chicken. 55 of the children preferred hamburger.
-Referring to Table 4-3, the probability that a randomly selected individual is a child or prefers hamburger is ________.
(Short Answer)
4.9/5 (38)
TABLE 4-11
A sample of 300 adults is selected. The contingency table below shows their registration status and their preferred source of information on current events.
-Referring to Table 4-11, is the preferred source of current information independent of the voting registration status?
(Essay)
4.9/5 (39)
TABLE 4-11
A sample of 300 adults is selected. The contingency table below shows their registration status and their preferred source of information on current events.
-Referring to Table 4-11, if an adult is selected at random, what is the probability that he/she prefers to get his/her current information from the Internet?
(Short Answer)
4.9/5 (25)
TABLE 4-2
An alcohol awareness task force at a Big-Ten university sampled 200 students after the midterm to ask them whether they went bar hopping the weekend before the midterm or spent the weekend studying, and whether they did well or poorly on the midterm. The following result was obtained.
 -Referring to Table 4-2, the events "Did Well on Midterm" and "Studying for Exam" are
(Multiple Choice)
4.8/5 (33)
TABLE 4-10
Are whites more likely to claim bias? It was found that 60% of the workers were white, 30% were black and 10% were other races. Given that a worker was white, the probability that the worker had claimed bias was 30%. Given that a worker was black, the probability that the worker had claimed bias was 40%. Given that a worker was other race, the probability that the worker had claimed bias was 0%.
-Referring to Table 4-10, if a randomly selected worker had claimed bias, what is the probability that the worker is white?
(Short Answer)
4.9/5 (36)
TABLE 4-5
In a meat packaging plant Machine A accounts for 60% of the plant's output, while Machine B accounts for 40% of the plant's output. In total, 4% of the packages are improperly sealed. Also, 3% of the packages are from Machine A and are improperly sealed.
-Referring to Table 4-5, if a package selected at random came from Machine A, the probability that it is improperly sealed is ________.
(Short Answer)
4.8/5 (42)
TABLE 4-7
The next state lottery will have the following 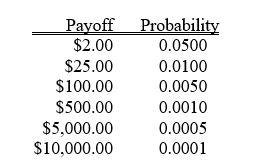 -Referring to Table 4-7, the probability that you win at least $100.00 is ________.
(Short Answer)
4.8/5 (29)
TABLE 4-11
A sample of 300 adults is selected. The contingency table below shows their registration status and their preferred source of information on current events.
-Referring to Table 4-11, if an adult is selected at random, what is the probability that he/she is a registered voter?
(Short Answer)
5.0/5 (35)
Filters
- Essay(0)
- Multiple Choice(0)
- Short Answer(0)
- True False(0)
- Matching(0)