Exam 9: Fundamentals of Hypothesis Testing: One-Sample Tests
Exam 1: Introduction118 Questions
Exam 2: Organizing and Visualizing Data210 Questions
Exam 3: Numerical Descriptive Measures143 Questions
Exam 4: Basic Probability171 Questions
Exam 5: Discrete Probability Distributions137 Questions
Exam 6: The Normal Distribution145 Questions
Exam 7: Sampling and Sampling Distributions197 Questions
Exam 8: Confidence Interval Estimation185 Questions
Exam 9: Fundamentals of Hypothesis Testing: One-Sample Tests168 Questions
Exam 10: Two-Sample Tests and One-Way ANOVA293 Questions
Exam 11: Chi-Square Tests108 Questions
Exam 12: Simple Linear Regression213 Questions
Exam 13: Introduction to Multiple Regression291 Questions
Exam 14: Statistical Applications in Quality Management107 Questions
Select questions type
The value that separates a rejection region from a non-rejection region is called the ________.
(Short Answer)
4.8/5  (38)
(38)
TABLE 9-9
The president of a university claimed that the entering class this year appeared to be larger than the entering class from previous years, but their mean SAT score is lower than previous years. He took a sample of 20 of this year's entering students and found that their mean SAT score is 1,501 with a standard deviation of 53. The university's record indicates that the mean SAT score for entering students from previous years is 1,520. He wants to find out if his claim is supported by the evidence at a 5% level of significance.
-Referring to Table 9-9, what critical value should the president use to determine the rejection region?
(Short Answer)
4.7/5 (35)
It is possible to directly compare the results of a confidence interval estimate to the results obtained by testing a null hypothesis if
(Multiple Choice)
4.9/5 (31)
You have created a 95% confidence interval for μ with the result 10 ≤ μ ≤ 15. What decision will you make if we test H₀: μ =16 versus H₁: μ ≠ 16 at α = 0.01?
(Multiple Choice)
4.9/5 (34)
You have created a 95% confidence interval for μ with the result 10 ≤ μ ≤ 15. What decision will you make if you test H₀: μ =16 versus H₁: μ ≠ 16 at α = 0.05?
(Multiple Choice)
4.7/5 (27)
Which of the following would be an appropriate alternative hypothesis?
(Multiple Choice)
4.9/5 (29)
TABLE 9-9
The president of a university claimed that the entering class this year appeared to be larger than the entering class from previous years, but their mean SAT score is lower than previous years. He took a sample of 20 of this year's entering students and found that their mean SAT score is 1,501 with a standard deviation of 53. The university's record indicates that the mean SAT score for entering students from previous years is 1,520. He wants to find out if his claim is supported by the evidence at a 5% level of significance.
-Referring to Table 9-9, the president can conclude that there is sufficient evidence to show that the mean SAT score of the entering class this year is lower than previous years with no more than a 5% probability of incorrectly rejecting the true null hypothesis.
(True/False)
4.8/5 (39)
TABLE 9-2
A student claims that he can correctly identify whether a person is a business major or an agriculture major by the way the person dresses. Suppose in actuality that if someone is a business major, the student can correctly identify that person as a business major 87% of the time. When a person is an agriculture major, the student will incorrectly identify that person as a business major 16% of the time. Presented with one person and asked to identify the major of this person (who is either a business or an agriculture major), the student considers this to be a hypothesis test with the null hypothesis being that the person is a business major and the alternative that the person is an agriculture major.
-Referring to Table 9-2, what would be a Type II error?
(Multiple Choice)
4.9/5 (30)
TABLE 9-3
An appliance manufacturer claims to have developed a compact microwave oven that consumes a mean of no more than 250 W. From previous studies, it is believed that power consumption for microwave ovens is normally distributed with a population standard deviation of 15 W. A consumer group has decided to try to discover if the claim appears true. They take a sample of 20 microwave ovens and find that they consume an mean of 257.3 W.
-Referring to Table 9-3, for this test to be valid, it is necessary that the power consumption for microwave ovens has a normal distribution.
(True/False)
4.7/5 (22)
A survey claims that 9 out of 10 doctors recommend aspirin for their patients with headaches. To test this claim against the alternative that the actual proportion of doctors who recommend aspirin is less than 0.90, a random sample of 100 doctors was selected. Suppose you reject the null hypothesis. What conclusion can you reach?
(Multiple Choice)
4.8/5 (31)
TABLE 9-9
The president of a university claimed that the entering class this year appeared to be larger than the entering class from previous years, but their mean SAT score is lower than previous years. He took a sample of 20 of this year's entering students and found that their mean SAT score is 1,501 with a standard deviation of 53. The university's record indicates that the mean SAT score for entering students from previous years is 1,520. He wants to find out if his claim is supported by the evidence at a 5% level of significance.
-Referring to Table 9-9, the population the president is interested in is:
(Multiple Choice)
4.9/5 (37)
If an economist wishes to determine whether there is evidence that mean family income in a community exceeds $50,000,
(Multiple Choice)
4.8/5 (38)
TABLE 9-8
One of the biggest issues facing e-retailers is the ability to turn browsers into buyers. This is measured by the conversion rate, the percentage of browsers who buy something in their visit to a site. The conversion rate for a company's website was 10.1%. The website at the company was redesigned in an attempt to increase its conversion rates. A samples of 200 browsers at the redesigned site was selected. Suppose that 24 browsers made a purchase. The company officials would like to know if there is evidence of an increase in conversion rate at the 5% level of significance.
-Referring to Table 9-8, what will be the p-value if these data were used to perform a two-tail test?
(Short Answer)
4.9/5 (34)
Suppose we wish to test H₀: μ ≤ 47 versus H₁: μ > 47. What will result if we conclude that the mean is greater than 47 when its true value is really 52?
(Multiple Choice)
4.7/5 (36)
TABLE 9-7
A major home improvement store conducted its biggest brand recognition campaign in the company's history. A series of new television advertisements featuring well-known entertainers and sports figures were launched. A key metric for the success of television advertisements is the proportion of viewers who "like the ads a lot". A study of 1,189 adults who viewed the ads reported that 230 indicated that they "like the ads a lot." The percentage of a typical television advertisement receiving the "like the ads a lot" score is believed to be 22%. Company officials wanted to know if there is evidence that the series of television advertisements are less successful than the typical ad (i.e., if there is evidence that the population proportion of "like the ads a lot" for the company's ads is less than 0.22) at a 0.01 level of significance.
-Referring to Table 9-7, state the alternative hypothesis for this study.
(Short Answer)
4.9/5 (25)
If the Type I error (α)for a given test is to be decreased, then for a fixed sample size n
(Multiple Choice)
4.8/5 (37)
TABLE 9-8
One of the biggest issues facing e-retailers is the ability to turn browsers into buyers. This is measured by the conversion rate, the percentage of browsers who buy something in their visit to a site. The conversion rate for a company's website was 10.1%. The website at the company was redesigned in an attempt to increase its conversion rates. A samples of 200 browsers at the redesigned site was selected. Suppose that 24 browsers made a purchase. The company officials would like to know if there is evidence of an increase in conversion rate at the 5% level of significance.
-Referring to Table 9-8, the null hypothesis will be rejected if the test statistic is
(Multiple Choice)
4.8/5 (39)
TABLE 9-7
A major home improvement store conducted its biggest brand recognition campaign in the company's history. A series of new television advertisements featuring well-known entertainers and sports figures were launched. A key metric for the success of television advertisements is the proportion of viewers who "like the ads a lot". A study of 1,189 adults who viewed the ads reported that 230 indicated that they "like the ads a lot." The percentage of a typical television advertisement receiving the "like the ads a lot" score is believed to be 22%. Company officials wanted to know if there is evidence that the series of television advertisements are less successful than the typical ad (i.e., if there is evidence that the population proportion of "like the ads a lot" for the company's ads is less than 0.22) at a 0.01 level of significance.
-Referring to Table 9-7, the largest level of significance at which the null hypothesis will not be rejected is ________.
(Short Answer)
5.0/5 (26)
TABLE 9-1
Microsoft Excel was used on a set of data involving the number of defective items found in a random sample of 46 cases of light bulbs produced during a morning shift at a plant. A manager wants to know if the mean number of defective bulbs per case is greater than 20 during the morning shift. She will make her decision using a test with a level of significance of 0.10. The following information was extracted from the Microsoft Excel output for the sample of 46 cases:
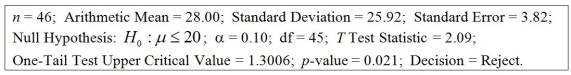 -Referring to Table 9-1, the null hypothesis would be rejected.
(True/False)
5.0/5 (29)
Filters
- Essay(0)
- Multiple Choice(0)
- Short Answer(0)
- True False(0)
- Matching(0)