Exam 7: Summarizing and Displaying Measurement Data
Exam 1: The Benefits and Risks of Using Statistics30 Questions
Exam 2: Reading the News50 Questions
Exam 3: Measurements, Mistakes, and Misunderstandings44 Questions
Exam 4: How to Get a Good Sample60 Questions
Exam 5: Experiments and Observational Studies60 Questions
Exam 6: Getting the Big Picture22 Questions
Exam 7: Summarizing and Displaying Measurement Data54 Questions
Exam 8: Bell-Shaped Curves and Other Shapes34 Questions
Exam 9: Plots, Graphs, and Pictures57 Questions
Exam 10: Relationships Between Measurement Variables35 Questions
Exam 11: Relationships Can Be Deceiving36 Questions
Exam 12: Relationships Between Categorical Variables36 Questions
Exam 13: Statistical Significance for 2 2 Tables33 Questions
Exam 14: Understanding Probability and Long-Term Expectations42 Questions
Exam 15: Understanding Uncertainty Through Simulation13 Questions
Exam 16: Psychological Influences on Personal Probability30 Questions
Exam 17: When Intuition Differs From Relative Frequency30 Questions
Exam 18: Understanding the Economic News23 Questions
Exam 19: The Diversity of Samples From the Same Population49 Questions
Exam 20: Estimating Proportions With Confidence31 Questions
Exam 21: The Role of Confidence Intervals in Research40 Questions
Exam 22: Rejecting Chancetesting Hypotheses in Research43 Questions
Exam 23: Hypothesis Testingexamples and Case Studies25 Questions
Exam 24: Significance, Importance, and Undetected Differences38 Questions
Exam 25: Meta-Analysis: Resolving Inconsistencies Across Studies23 Questions
Exam 26: Ethics in Statistical Studies29 Questions
Exam 27: Putting What You Have Learned to the Test46 Questions
Select questions type
A __________ is a quick and easy way to put a list of numbers into order while getting a picture of their shape.
Free
(Short Answer)
4.9/5  (40)
(40)
Correct Answer: Verified
stemplot
What is wrong with the following statement: "Today's temperature of 101 in Los Angeles was a record high for October, a whopping 17 degrees above normal for this date."
Free
(Essay)
4.8/5 (31)
Correct Answer:Verified
THe word 'normal' is being confused with the word 'average.'
For Questions , use the following narrative
Narrative: Liberal arts costs
A random sample of 25 liberal arts colleges in the U.S.was selected, and the average cost per student was recorded for each school.The following five-number summary was calculated for this data set: lowest = $17,554; lower quartile = $23,115; median = $26,668; upper quartile = $45,879; highest = $102,262.
-{Liberal arts costs narrative} Using the definition of outlier discussed in your textbook, is there an outlier in this data set? Explain your answer.
Free
(Essay)
4.8/5 (37)
Correct Answer:Verified
Yes.The highest amount, $102,262 is more than 1.5 times the IQR away from the upper end of the box.
Suppose that in a five-number summary you find that a larger gap exists between the extremes and the quartiles than between the quartiles and the median.What does this mean about the shape of the data set?
(Multiple Choice)
4.8/5 (39)
Which of the following measures of center is affected by an outlier?
(Multiple Choice)
4.8/5 (49)
Name the four kinds of useful information that you can get about a set of measurement data once it has been organized and summarized.
(Essay)
4.8/5 (43)
For Questions , use the following narrative
Narrative: Liberal arts costs
A random sample of 25 liberal arts colleges in the U.S.was selected, and the average cost per student was recorded for each school.The following five-number summary was calculated for this data set: lowest = $17,554; lower quartile = $23,115; median = $26,668; upper quartile = $45,879; highest = $102,262.
-{Liberal arts costs narrative} Make a boxplot of this data set and use it to discuss the shape of the data.
(Essay)
4.8/5 (40)
For Questions , use the following narrative
Narrative: Create data
Suppose you can create your own data set by choosing from the numbers 1, 2, 3, 4, and 5.You can repeat a number as many times as you wish, as long as your final data set contains four numbers in it.Here are two examples of data sets you could create: {1, 2, 3, 4} or {1, 1, 5, 5}.
-{Create data narrative} Create a data set that has mean 3 and standard deviation 0.
(Essay)
4.9/5 (35)
The __________ is the distance between the lower and upper quartiles in a boxplot.
(Short Answer)
4.8/5 (28)
The __________ are the medians of the two halves of an ordered data set.
(Short Answer)
4.9/5 (34)
For Questions , use the following narrative
Narrative: Acceptance rates
A random sample of 50 colleges and universities in the U.S.was selected, and acceptance rates were recorded for each school (percentage of student applicants who were accepted to the school).The following five-number summary was calculated for this data set: lowest = 17; lower quartile = 25.75; median = 36; upper quartile = 47.75; highest = 67.
-{Acceptance rates narrative} Describe the center of this data set in words a prospective student would understand.
(Essay)
4.9/5 (35)
If you just use an average to describe a set of measurements, is this enough? Explain your answer.
(Essay)
4.8/5 (32)
Which of the following two data sets has the larger standard deviation: Data Set A= {1, 1, 5, 5} or Data Set B= {1, 3, 3, 5}?
(Essay)
4.9/5 (38)
Describe which numerical summaries (statistics) of a dataset a boxplot is based upon.
(Essay)
4.9/5 (41)
For Questions , use the following narrative
Narrative: Quiz scores
Bob has taken 6 quizzes so far in his statistics class.Each quiz has a possible of 10 total points.Bob's scores are the following: 10, 8, 9, 7, 2, and 9.
-{Quiz scores narrative} Find the three measures of center for Bob's quiz scores.
(Essay)
4.9/5 (39)
For Questions , use the following narrative
Narrative: School costs
Suppose a random sample of liberal arts schools was taken, and the average cost per student was measured for each school.The data are pictured in the histogram below:
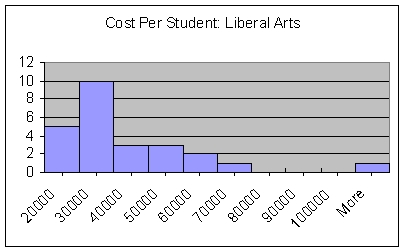 -{School cost narrative} How many schools were sampled in this study?
(Essay)
4.9/5 (33)
For Questions , use the following narrative
Narrative: Acceptance rates
A random sample of 50 colleges and universities in the U.S.was selected, and acceptance rates were recorded for each school (percentage of student applicants who were accepted to the school).The following five-number summary was calculated for this data set: lowest = 17; lower quartile = 25.75; median = 36; upper quartile = 47.75; highest = 67.
-{Acceptance rates narrative} Find the range of the acceptance rates and give one possible reason that it is such a high number.
(Essay)
4.9/5 (34)
A five-number summary involves the lower quartile, the upper quartile, the lowest number, the highest number, and the __________.
(Short Answer)
4.9/5 (37)
What is the relationship between the variance and the standard deviation?
(Multiple Choice)
4.9/5 (45)
Filters
- Essay(0)
- Multiple Choice(0)
- Short Answer(0)
- True False(0)
- Matching(0)