Exam 10: Relationships Between Measurement Variables
Exam 1: The Benefits and Risks of Using Statistics30 Questions
Exam 2: Reading the News50 Questions
Exam 3: Measurements, Mistakes, and Misunderstandings44 Questions
Exam 4: How to Get a Good Sample60 Questions
Exam 5: Experiments and Observational Studies60 Questions
Exam 6: Getting the Big Picture22 Questions
Exam 7: Summarizing and Displaying Measurement Data54 Questions
Exam 8: Bell-Shaped Curves and Other Shapes34 Questions
Exam 9: Plots, Graphs, and Pictures57 Questions
Exam 10: Relationships Between Measurement Variables35 Questions
Exam 11: Relationships Can Be Deceiving36 Questions
Exam 12: Relationships Between Categorical Variables36 Questions
Exam 13: Statistical Significance for 2 2 Tables33 Questions
Exam 14: Understanding Probability and Long-Term Expectations42 Questions
Exam 15: Understanding Uncertainty Through Simulation13 Questions
Exam 16: Psychological Influences on Personal Probability30 Questions
Exam 17: When Intuition Differs From Relative Frequency30 Questions
Exam 18: Understanding the Economic News23 Questions
Exam 19: The Diversity of Samples From the Same Population49 Questions
Exam 20: Estimating Proportions With Confidence31 Questions
Exam 21: The Role of Confidence Intervals in Research40 Questions
Exam 22: Rejecting Chancetesting Hypotheses in Research43 Questions
Exam 23: Hypothesis Testingexamples and Case Studies25 Questions
Exam 24: Significance, Importance, and Undetected Differences38 Questions
Exam 25: Meta-Analysis: Resolving Inconsistencies Across Studies23 Questions
Exam 26: Ethics in Statistical Studies29 Questions
Exam 27: Putting What You Have Learned to the Test46 Questions
Select questions type
Explain how sample size can affect whether or not a relationship is found to be statistically significant (discuss the very small and very large sample cases).
Free
(Essay)
4.9/5  (45)
(45)
Correct Answer: Verified
if the sample size is very small, a relationship that exists in the population may go undetected (not statistically significant).If the sample size is very large, a relationship that is not very strong in the population may be detected (statistically significant).
Explain the difference between a statistical relationship and a deterministic relationship.
Free
(Essay)
4.9/5 (38)
Correct Answer:Verified
in a deterministic relationship, if we know the value of one variable, we can determine the value of the other exactly.In a statistical relationship, natural variability exists in both measurements; we can talk about average relationships, not exact ones.
The __________ between two measurement variables is an indicator of how closely their values fall to a straight line.
Free
(Short Answer)
5.0/5 (38)
Correct Answer:Verified
correlation
The __________ of the sample can greatly affect whether or not a relationship is found to be statistically __________.
(Short Answer)
4.9/5 (38)
What type of statistical error is being made in the following statement? "If this uphill linear trend continues, 50 years from now, one out of every three of us will be an Elvis impersonator."
(Multiple Choice)
4.7/5 (37)
If there is no linear relationship between two measurement variables, the correlation is __________.
(Short Answer)
4.9/5 (33)
For Questions , use the following narrative
Narrative: Study time and exam score
Suppose an algebra professor found that the correlation between study time (in hours) and exam score (out of 100) is +.80, and the regression line was found to be y = 20 + 4x.He arrived at this equation through years of collecting data on his students, most of whom reported studying anywhere from 0 to 20 hours for his exams.
-{Study time and exam score narrative} For which values of study time does the professor's regression equation make sense in terms of predicting exam scores?
(Multiple Choice)
4.9/5 (34)
For Questions , use the following narrative
Narrative: Study time and exam score
Suppose an algebra professor found that the correlation between study time (in hours) and exam score (out of 100) is +.80, and the regression line was found to be y = 20 + 4x.He arrived at this equation through years of collecting data on his students, most of whom reported studying anywhere from 0 to 20 hours for his exams.
-{Study time and exam score narrative} Suppose the professor later found out that his correlation was not +.80, but rather it was +.08.How does this change the predictions he can make about exam scores based on study time?
(Multiple Choice)
4.8/5 (34)
For Questions , use the following narrative
Narrative: Study time and exam score
Suppose an algebra professor found that the correlation between study time (in hours) and exam score (out of 100) is +.80, and the regression line was found to be y = 20 + 4x.He arrived at this equation through years of collecting data on his students, most of whom reported studying anywhere from 0 to 20 hours for his exams.
-{Study time and exam score narrative} Which variable is X and which variable is Y in this situation?
(Essay)
4.8/5 (27)
For Questions , use the following narrative
Narrative: Study time and exam score
Suppose an algebra professor found that the correlation between study time (in hours) and exam score (out of 100) is +.80, and the regression line was found to be y = 20 + 4x.He arrived at this equation through years of collecting data on his students, most of whom reported studying anywhere from 0 to 20 hours for his exams.
-{Study time and exam score narrative} What meaning (if any) does the y intercept of 20 have in this situation? Use words that a non-statistics student would be able to understand.
(Essay)
4.7/5 (42)
Most researchers are willing to declare that a relationship is statistically significant if the chances of observing the relationship in the sample when actually nothing is going in the population are less than what percent?
(Multiple Choice)
4.9/5 (34)
For Questions , use the following narrative
Narrative: Crickets and temperature
A researcher wants to explore the relationship between cricket chirps and temperature.The following scatterplot shows data collected over a random sample of 8 days.Each day, the temperature was recorded, as well as the number of times a cricket chirped in 15 seconds.The correlation was found to be over .90.The least squares line was found to be Temperature (in Fahrenheit) = 40 + 1.0 × (#Chirps in 15 seconds).  -{Crickets and temperature narrative} On nights when crickets chirp 120 times per minute, what do you predict the temperature to be, on average?
(Essay)
4.9/5 (42)
A researcher wants to explore the relationship between cricket chirps and temperature.The following scatterplot shows data collected over a random sample of 8 days.Each day, the temperature was recorded, as well as the number of times a cricket chirped in 15 seconds.According to this scatterplot, what can be said (if anything) about the relationship between cricket chirps and temperature? 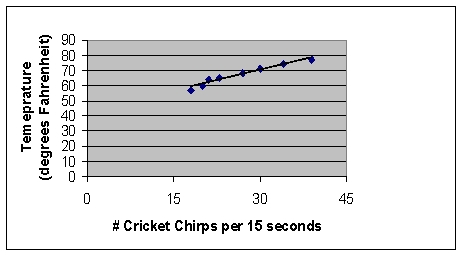
(Multiple Choice)
5.0/5 (42)
A relationship is considered to be statistically significant if that relationship is stronger than what percent of the relationships we would expect to see just by chance?
(Multiple Choice)
4.9/5 (40)
Explain how a relationship may exist between two variables in a sample even if there is no relationship between the two variables in that population.
(Essay)
4.7/5 (38)
Statistical relationships such as correlation are useful for describing features of __________.
(Multiple Choice)
4.8/5 (34)
For Questions , use the following narrative
Narrative: Crickets and temperature
A researcher wants to explore the relationship between cricket chirps and temperature.The following scatterplot shows data collected over a random sample of 8 days.Each day, the temperature was recorded, as well as the number of times a cricket chirped in 15 seconds.The correlation was found to be over .90.The least squares line was found to be Temperature (in Fahrenheit) = 40 + 1.0 × (#Chirps in 15 seconds).
-{Crickets and temperature narrative} On nights when crickets chirp 20 times in 15 seconds, what do you predict the temperature to be, on average?
(Essay)
4.7/5 (38)
To be convincing, an observed relationship must also be statistically __________.
(Short Answer)
4.7/5 (39)
Determine whether or not the following statement could be statistically correct.If not, explain why not."We found a strong correlation between gender and political party."
(Essay)
4.9/5 (42)
Determine whether or not the following statement could be statistically correct.If not, explain why not."The correlation between height and weight is +0.8, so the correlation between weight and height must be −0.8."
(Essay)
4.9/5 (34)
Filters
- Essay(0)
- Multiple Choice(0)
- Short Answer(0)
- True False(0)
- Matching(0)