Exam 7: Summarizing and Displaying Measurement Data
Exam 1: The Benefits and Risks of Using Statistics30 Questions
Exam 2: Reading the News50 Questions
Exam 3: Measurements, Mistakes, and Misunderstandings44 Questions
Exam 4: How to Get a Good Sample60 Questions
Exam 5: Experiments and Observational Studies60 Questions
Exam 6: Getting the Big Picture22 Questions
Exam 7: Summarizing and Displaying Measurement Data54 Questions
Exam 8: Bell-Shaped Curves and Other Shapes34 Questions
Exam 9: Plots, Graphs, and Pictures57 Questions
Exam 10: Relationships Between Measurement Variables35 Questions
Exam 11: Relationships Can Be Deceiving36 Questions
Exam 12: Relationships Between Categorical Variables36 Questions
Exam 13: Statistical Significance for 2 2 Tables33 Questions
Exam 14: Understanding Probability and Long-Term Expectations42 Questions
Exam 15: Understanding Uncertainty Through Simulation13 Questions
Exam 16: Psychological Influences on Personal Probability30 Questions
Exam 17: When Intuition Differs From Relative Frequency30 Questions
Exam 18: Understanding the Economic News23 Questions
Exam 19: The Diversity of Samples From the Same Population49 Questions
Exam 20: Estimating Proportions With Confidence31 Questions
Exam 21: The Role of Confidence Intervals in Research40 Questions
Exam 22: Rejecting Chancetesting Hypotheses in Research43 Questions
Exam 23: Hypothesis Testingexamples and Case Studies25 Questions
Exam 24: Significance, Importance, and Undetected Differences38 Questions
Exam 25: Meta-Analysis: Resolving Inconsistencies Across Studies23 Questions
Exam 26: Ethics in Statistical Studies29 Questions
Exam 27: Putting What You Have Learned to the Test46 Questions
Select questions type
Suppose you look at two boxplots comparing the weights of male cats vs.female cats, and you find that the box for the males is much wider than the box for the females.What does this mean about the data sets?
(Multiple Choice)
4.8/5  (47)
(47)
Name two questions that can be answered by determining the shape of a data set.
(Essay)
4.9/5 (35)
For Questions , use the following narrative
Narrative: School costs
Suppose a random sample of liberal arts schools was taken, and the average cost per student was measured for each school.The data are pictured in the histogram below:
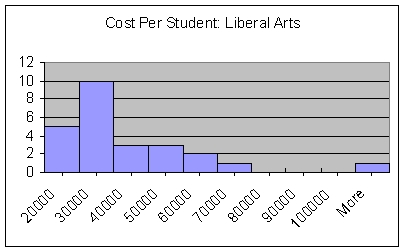 -{School cost narrative} Two measures of center were calculated for this data set and were found to be $26,668, and $34,832.One of them is the mean, and the other is the median.Which one is which, and how do you know that?
(Essay)
4.8/5 (37)
The __________ is a measure of center with half of the scores falling at or above it and half of the scores falling at or below it.
(Short Answer)
4.7/5 (44)
A data set is __________ if the two halves of the data set (when cut down the middle) are mirror images of each other.
(Short Answer)
4.8/5 (32)
The amount of spread in the data is a measure of what characteristic of a data set?
(Multiple Choice)
5.0/5 (27)
Which of the following does not require the data to be ordered before you can get the right answer?
(Multiple Choice)
4.8/5 (38)
Which of the following is not a measure of spread or variability in a data set?
(Multiple Choice)
4.8/5 (46)
Explain what is meant by the standard deviation in terms that a non-statistician would understand.
(Essay)
4.8/5 (32)
For Questions , use the following narrative
Narrative: School costs
Suppose a random sample of liberal arts schools was taken, and the average cost per student was measured for each school.The data are pictured in the histogram below:
-{School cost narrative} Describe the four important characteristics of this data set (for example, the shape) using words that a parent exploring the cost of liberal arts colleges would find useful.
(Essay)
4.9/5 (36)
If the shape of a data set is __________ then the mean and the median should be about equal.
(Short Answer)
4.8/5 (31)
Which of the following methods is the most appropriate one for 'proving' someone cheated on a multiple choice exam who was allegedly looking at someone else's paper?
(Multiple Choice)
4.8/5 (33)
Because the __________ can be distorted by high outliers, the center of a data set involving incomes or prices is usually summarized using the __________.
(Short Answer)
4.9/5 (42)
Which of the following statements is statistically correct?
(Multiple Choice)
4.8/5 (37)
Which of the following statements regarding stemplots is false?
(Multiple Choice)
4.8/5 (42)
For Questions , use the following narrative
Narrative: Quiz scores
Bob has taken 6 quizzes so far in his statistics class.Each quiz has a possible of 10 total points.Bob's scores are the following: 10, 8, 9, 7, 2, and 9.
-{Quiz scores narrative} Explain how (if) Bob's lowest quiz score affects the mean and the median of this data set.
(Essay)
5.0/5 (33)
Suppose that in a five-number summary you find that a larger gap exists between the third quartile and the highest value than between the lowest value and the first quartile.What does this mean about the shape of the data set?
(Multiple Choice)
4.8/5 (31)
Filters
- Essay(0)
- Multiple Choice(0)
- Short Answer(0)
- True False(0)
- Matching(0)