Exam 8: Types of Distributions
Exam 1: Why Study Statistics12 Questions
Exam 2: Use of Statistics in Evidence-Based Practice21 Questions
Exam 3: Review of Key Research Methodology Concepts and Terms22 Questions
Exam 4: Frequency Distributions21 Questions
Exam 5: Graphs and Charts15 Questions
Exam 6: Measures of Central Tendency19 Questions
Exam 7: Measures of Dispersion20 Questions
Exam 8: Types of Distributions18 Questions
Exam 9: Z-Scores, Percentiles and Effect Size15 Questions
Exam 10: Probability and Sampling Distributions24 Questions
Exam 11: Hypothesis Testing and Statistical Significance20 Questions
Exam 12: Type I and Type Ii Errors23 Questions
Exam 13: Interpreting the Strength and Importance of Relationships27 Questions
Exam 14: The T-Test25 Questions
Exam 15: Analysis of Variance19 Questions
Exam 16: Cross Tabulation and Chi-Square22 Questions
Exam 17: Correlation23 Questions
Exam 18: Regression Analysis26 Questions
Exam 19: Applications to Single-System Evaluation Designs20 Questions
Select questions type
Some normal curves are more peaked or flatter than others.
Free
(True/False)
4.8/5  (38)
(38)
Correct Answer: Verified
True
In a normal distribution, the right and left halves of the curve are mirror images of each other.
Free
(True/False)
4.9/5 (32)
Correct Answer:Verified
True
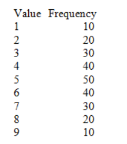
Given the following frequency distribution, the distribution is: 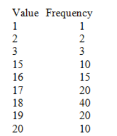
(Multiple Choice)
4.8/5 (31)
A positively skewed distribution has more values below the mean than above it.
(True/False)
4.7/5 (27)
Given the following frequency distribution, the distribution is:
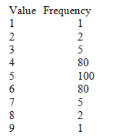
(Multiple Choice)
4.9/5 (37)
In a normal distribution, approximately 99 percent of all the cases fall between the x-axis values that are one standard deviation less than the mean and one standard deviation greater than the mean.
(True/False)
4.9/5 (38)
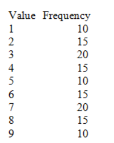
Given the following frequency distribution, the distribution is:
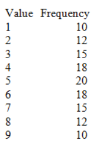
(Multiple Choice)
4.8/5 (33)
Given the following frequency distribution, the distribution is:
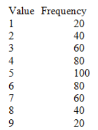
(Multiple Choice)
4.8/5 (30)
If a normal curve has a mean of 50 and a standard deviation of 9, then the value at one standard deviation below the mean is:
(Multiple Choice)
4.7/5 (39)
If normal curve A has a mean of 50 and a standard deviation of 5, and normal curve B has a mean of 50 and a standard deviation of 10, then:
(Multiple Choice)
4.9/5 (30)
In a negatively skewed distribution, more values are below the mean, but the mean is increased by some extremely high values above it.
(True/False)
4.9/5 (27)
The greater the kurtosis statistic, the taller, narrower and more peaked the curve.
(True/False)
4.8/5 (42)
A normal curve with a mean of 100 and a standard deviation of 30 will have the same degree of kurtosis as a normal curve with a mean of 100 and a standard deviation of 5.
(True/False)
4.8/5 (27)
Given the following frequency distribution, the distribution is:
(Multiple Choice)
4.9/5 (29)
Given the following frequency distribution, the distribution is: 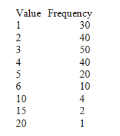
(Multiple Choice)
4.9/5 (35)
Given the following frequency distribution, the distribution is:
(Multiple Choice)
4.8/5 (40)
Filters
- Essay(0)
- Multiple Choice(0)
- Short Answer(0)
- True False(0)
- Matching(0)