Exam 8: Macroeconomic Equilibrium: Aggregate Demand and Supply
Exam 1: Economics: the World Around You90 Questions
Exam 2: Choice, Opportunity Costs, and Specialization98 Questions
Exam 3: Markets, Demand and Supply, and the Price System99 Questions
Exam 4: The Market System and the Private and Public Sector100 Questions
Exam 5: National Income Accounting104 Questions
Exam 6: An Introduction to the Foreign Exchange Market and the Balance of Payments90 Questions
Exam 7: Unemployment and Inflation130 Questions
Exam 8: Macroeconomic Equilibrium: Aggregate Demand and Supply123 Questions
Exam 9: Aggregate Expenditures120 Questions
Exam 10: Income and Expenditures Equilibrium135 Questions
Exam 11: Fiscal Policy94 Questions
Exam 12: Money and Banking125 Questions
Exam 13: Monetary Policy138 Questions
Exam 14: Macroeconomic Policy: Tradeoffs, Expectations, Credibility, and Sources of Business Cycles117 Questions
Exam 15: Macroeconomic Viewpoints: New Keynesian, Monetarist, and New Classical103 Questions
Exam 16: Economic Growth99 Questions
Exam 17: Development Economics105 Questions
Exam 18: Globalization85 Questions
Exam 19: World Trade Equilibrium112 Questions
Exam 20: International Trade Restrictions109 Questions
Exam 21: Exchange Rates and Financial Links Between Countries132 Questions
Select questions type
The table given below reports the inflation rate in the U.S. and Canada for two years.
Table 8.1
United States Canada Inflation Rate (year 1) 0\% 0\% Inflation Rate (year 2) 0\% 3.6\%
-Refer to Table 8.1. Assume the exchange rate is fixed at 1.4 CAD (Canadian dollars) = 1 USD (United States dollars). Between year 1 and year 2, what happens to the U.S. aggregate demand curve?
(Multiple Choice)
4.7/5  (40)
(40)
The aggregate supply curve shows the negative relationship between general price level and real GDP.
(True/False)
4.8/5 (39)
The _____ is the change in the purchasing power of assets that causes spending to change when the price level changes.
(Multiple Choice)
5.0/5 (46)
The figure given below represents the equilibrium real GDP and price level in the aggregate demand and aggregate supply model.
Figure 8.3
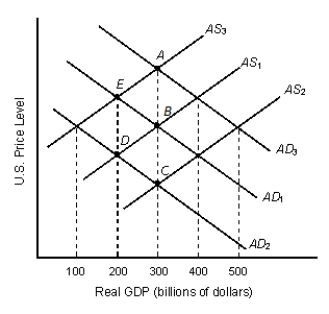 -Refer to Figure 8.3. If AS1 and AD1 represent the initial aggregate demand and supply in the economy, the long-run equilibrium real GDP will be _____ billion.
(Multiple Choice)
4.8/5 (42)
The main reason why the short-run aggregate supply curve slopes upward is that as the average price level increases, larger scales of production become more profitable.
(True/False)
4.8/5 (42)
The intersection of the aggregate demand and the aggregate supply curve defines the equilibrium level of _____ and the price level.
(Multiple Choice)
4.9/5 (33)
If there is a sudden jump in the inflation rate, the purchasing power of financial assets will immediately fall.
(True/False)
5.0/5 (35)
Which of the following is true of the aggregate demand curve?
(Multiple Choice)
4.8/5 (41)
The economic reasons that underlie the shape of the aggregate supply curve are different from those that underlie the shape of the supply curve for a particular good.
(True/False)
4.9/5 (39)
The slope of the aggregate supply curve becomes steeper, the faster the costs of production adjust to prices and the smaller the amount of excess capacity in the economy.
(True/False)
4.7/5 (45)
Firms' profits or production do not increase in the long run because:
(Multiple Choice)
4.7/5 (41)
The table given below reports the inflation rate in the U.S. and Canada for two years.
Table 8.1
United States Canada Inflation Rate (year 1) 0\% 0\% Inflation Rate (year 2) 0\% 3.6\%
-Refer to Table 8.1. Assume that the exchange rate is fixed at 1.4 CAD = $1 and that price changes for salmon are identical to the inflation rate in each country. If U.S. importers pay 10,000 CAD for a trailer of Canadian salmon in year 1, what is the approximate price of that salmon in year 2, given that exchange rates do not change?
(Multiple Choice)
4.8/5 (37)
As the general price level in the country of Norweinshire rose, the average interest rate in the economy increased, thereby lowering aggregate expenditure. This relationship between price level, interest rate, and aggregate expenditure is referred to as the:
(Multiple Choice)
4.8/5 (28)
_____ is the relation between total expenditures, or total spending, and the price level.
(Multiple Choice)
4.8/5 (41)
A decrease in the relative price of economics textbooks will raise the aggregate quantity of an economy's goods and services demanded.
(True/False)
4.9/5 (34)
A demand-pull inflation is caused by an increase in the demand for output. Therefore, economists say that this type of inflation is actually good for the economy.
(True/False)
4.9/5 (39)
The figure given below represents the long-run equilibrium in the aggregate demand and aggregate supply model.
Figure 8.2
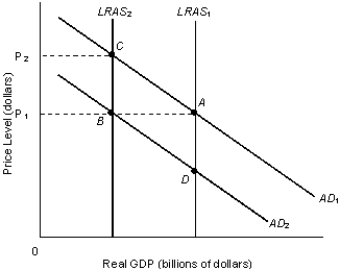 -Refer to Figure 8.2. A movement from equilibrium point A to equilibrium point B would be the result of a(n):
(Multiple Choice)
4.8/5 (28)
Filters
- Essay(0)
- Multiple Choice(0)
- Short Answer(0)
- True False(0)
- Matching(0)