Exam 8: Macroeconomic Equilibrium: Aggregate Demand and Supply
Exam 1: Economics: the World Around You90 Questions
Exam 2: Choice, Opportunity Costs, and Specialization98 Questions
Exam 3: Markets, Demand and Supply, and the Price System99 Questions
Exam 4: The Market System and the Private and Public Sector100 Questions
Exam 5: National Income Accounting104 Questions
Exam 6: An Introduction to the Foreign Exchange Market and the Balance of Payments90 Questions
Exam 7: Unemployment and Inflation130 Questions
Exam 8: Macroeconomic Equilibrium: Aggregate Demand and Supply123 Questions
Exam 9: Aggregate Expenditures120 Questions
Exam 10: Income and Expenditures Equilibrium135 Questions
Exam 11: Fiscal Policy94 Questions
Exam 12: Money and Banking125 Questions
Exam 13: Monetary Policy138 Questions
Exam 14: Macroeconomic Policy: Tradeoffs, Expectations, Credibility, and Sources of Business Cycles117 Questions
Exam 15: Macroeconomic Viewpoints: New Keynesian, Monetarist, and New Classical103 Questions
Exam 16: Economic Growth99 Questions
Exam 17: Development Economics105 Questions
Exam 18: Globalization85 Questions
Exam 19: World Trade Equilibrium112 Questions
Exam 20: International Trade Restrictions109 Questions
Exam 21: Exchange Rates and Financial Links Between Countries132 Questions
Select questions type
The AD curve will shift to the right if:
Free
(Multiple Choice)
4.8/5  (34)
(34)
Correct Answer: Verified
E
Other things equal, investment spending will increase when:
Free
(Multiple Choice)
4.9/5 (38)
Correct Answer:Verified
A
Suppose a representative household holds a bond that is expected to pay a real return of $100 one year from now. However, over the next year, the inflation rate rises 15 percent more than was originally anticipated. As a consequence:
Free
(Multiple Choice)
4.9/5 (42)
Correct Answer:Verified
E
To determine short-run equilibrium in the economy, we use an aggregate supply curve that is:
(Multiple Choice)
4.8/5 (41)
Each of the panels given below represents the short-run equilibrium in the U.S. economy. The Aggregate Demand and Aggregate Supply curves in each panel responds to various economic changes.
Figure 8.1
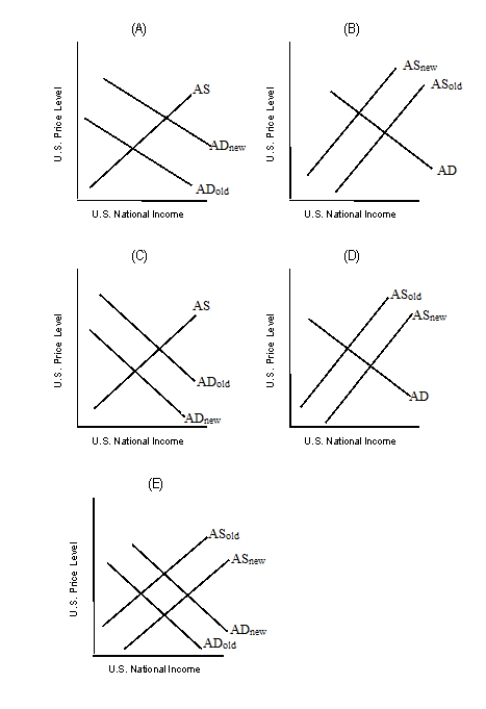 -Refer to Figure 8.1. Which of the graphs in the figure best describes the impact of lower real income in Germany on U.S. equilibrium real GDP and the U.S. equilibrium price level?
(Multiple Choice)
4.8/5 (36)
The fact that the aggregate demand curve slopes downward means that aggregate expenditures increase when the price level decreases.
(True/False)
4.9/5 (41)
The figure given below represents the equilibrium real GDP and price level in the aggregate demand and aggregate supply model.
Figure 8.3
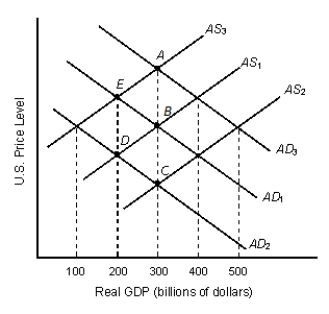 -In Figure 8.3, which of the following shifts would result in stagflation (economic stagnation and inflation)?
(Multiple Choice)
4.9/5 (42)
As the level of real GDP increases, the short-run aggregate supply curve:
(Multiple Choice)
4.8/5 (40)
The figure given below represents the long-run equilibrium in the aggregate demand and aggregate supply model.
Figure 8.2
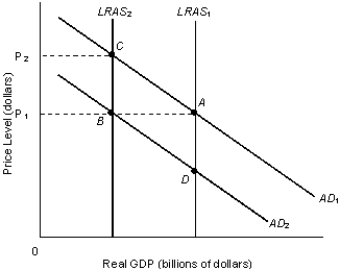 -Refer to Figure 8.2. Suppose major oil-exporting countries restrict oil output, thus increasing the price of oil. This would be represented by:
(Multiple Choice)
4.8/5 (39)
A rightward shift in the aggregate supply curve is generally associated with a reduction in resource prices.
(True/False)
4.7/5 (42)
A simultaneous increase in inflation and decrease in economic growth in a country can be associated with:
(Multiple Choice)
5.0/5 (37)
If a large number of laborers shift from fixed-wage contracts to wages that depend on the cost of living adjustments, the long-run aggregate supply curve for the economy will become relatively steeper.
(True/False)
4.9/5 (32)
The long-run aggregate supply of an economy at the potential level of real GDP is graphically represented by:
(Multiple Choice)
4.9/5 (42)
The figure given below represents the equilibrium real GDP and price level in the aggregate demand and aggregate supply model.
Figure 8.3
-Consider Figure 8.3. Which of the following is most likely to have led to the movement from point B to point E?
(Multiple Choice)
5.0/5 (37)
The wealth effect and the interest rate effect are changes in the price level that:
(Multiple Choice)
4.9/5 (31)
Which of the following economic changes will decrease household expenditures?
(Multiple Choice)
4.8/5 (42)
Filters
- Essay(0)
- Multiple Choice(0)
- Short Answer(0)
- True False(0)
- Matching(0)