Exam 15: Cell Signaling
Exam 1: Cells and Genomes34 Questions
Exam 2: Cell Chemistry and Bioenergetics54 Questions
Exam 3: Proteins52 Questions
Exam 4: DNA, Chromosomes, and Genomes57 Questions
Exam 5: DNA Replication, Repair, and Recombination51 Questions
Exam 6: How Cells Read the Genome: From DNA to Protein58 Questions
Exam 7: Control of Gene Expression62 Questions
Exam 8: Analyzing Cells, Molecules, and Systems95 Questions
Exam 9: Visualizing Cells29 Questions
Exam 10: Membrane Structure26 Questions
Exam 11: Membrane Transport of Small Molecules and the Electrical Properties of Membranes46 Questions
Exam 12: Intracellular Compartments and Protein Sorting46 Questions
Exam 13: Intracellular Membrane Traffic54 Questions
Exam 14: Energy Conversion: Mitochondria and Chloroplasts49 Questions
Exam 15: Cell Signaling63 Questions
Exam 16: The Cytoskeleton75 Questions
Exam 17: The Cell Cycle57 Questions
Exam 18: Cell Death12 Questions
Exam 19: Cell Junctions and the Extracellular Matrix56 Questions
Exam 20: Cancer50 Questions
Exam 21: Development of Multicellular Organisms61 Questions
Exam 22: Stem Cells and Tissue Renewal45 Questions
Exam 23: Pathogens and Infection32 Questions
Exam 24: The Innate and Adaptive Immune Systems47 Questions
Select questions type
You have studied the circadian clock in a certain mouse strain by monitoring the physical activity (e.g. wheel-running) of a few mice over an extended period of time. For the first week, you kept the mice under normal 12 hr light /12 hr dark cycles; they were then transferred to constant darkness. You have plotted the average activity of the mice in the following graph. The light and dark conditions are represented with white and gray backgrounds, respectively. The activity in each day is plotted in black in one row of the graph, and consecutive days are arranged from the top to the bottom. The horizontal axis represents the time of the day. Based on these results, what is the most accurate estimate for the free-running period of the circadian clock in this mouse strain? 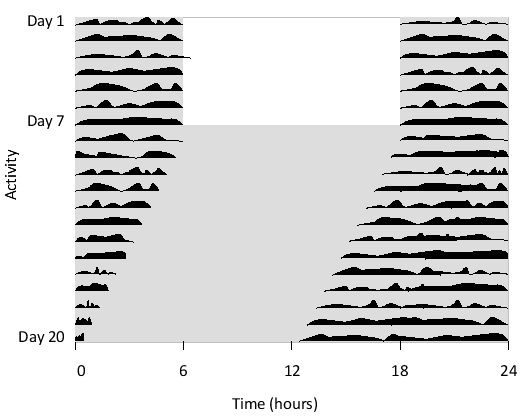
Free
(Multiple Choice)
4.9/5  (35)
(35)
Correct Answer: Verified
D
Which of the following is NOT a common second messenger in cell signaling?
Free
(Multiple Choice)
4.8/5 (28)
Correct Answer:Verified
D
In the following graphs, the cellular response, as measured in real time by the concentration of a certain active effector protein, is plotted over time for five cell types (A to E) that are treated with three different concentrations of a signal molecule. During the time period indicated by the horizontal gray bar, the signal molecule is present in the culture media at a concentration of 1 nM (dotted curve), 5 nM (gray curve), or 25 nM (solid curve). Answer the following question(s) based on these graphs.
-Which of the cell types A to E shows the widest dynamic range of signal concentration?
A)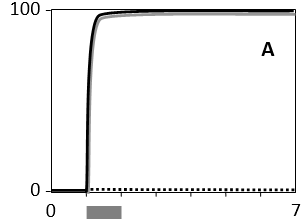 B)
B)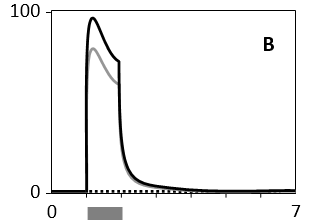 C)
C)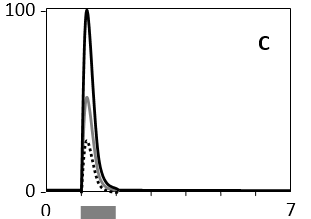 D)
D)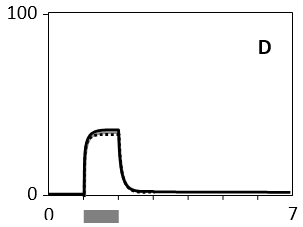 E)
E)
Free
(Short Answer)
4.8/5 (42)
Correct Answer:Verified
C
In the following schematic diagrams of ethylene signaling in plants, 1 denotes ethylene, 2 denotes ethylene receptor, 3 denotes CTR1, 4 denotes EIN3, and 5 represents the expression of ethylene-responsive genes. Which diagram better depicts the signaling pathway? Activation and inhibition are indicated as normal and blunt arrows, respectively.
(Multiple Choice)
4.8/5 (40)
Consider a signaling protein that is only made up of one SH2 domain and two SH3 domains. This protein is most likely ...
(Multiple Choice)
4.8/5 (38)
Indicate true (T) and false (F) statements below regarding G-protein-coupled receptors (GPCRs). Your answer would be a five-letter string composed of letters T and F only, e.g. TTFFF.
( ) All GPCRs share a similar structure composed of seven transmembrane helices.
( ) All GPCR ligands (signal molecules) have a similar structure.
( ) GPCRs have only been found in multicellular organisms, consistent with their role in intercellular signaling.
( ) The hormone insulin is recognized by a GPCR on the surface of its target cells.
( ) Once activated, a GPCR molecule can activate multiple molecules of G protein to amplify the incoming signal.
(Short Answer)
4.8/5 (36)
Which of the following is a major consequence of activation of phospholipase C-β (PLCβ) by the Gq trimeric GTPase?
(Multiple Choice)
4.8/5 (34)
Arabidopsis thaliana seedlings show positive phototropism: they bend and grow toward the source of (blue) light. However, phototropism is not observed if the seedlings are treated with an auxin efflux inhibitor called NPA. Knowing that auxin stimulates elongation of the cells in the growing shoot, these observations are consistent with a model in which, in the presence of a lateral light, ...
(Multiple Choice)
4.7/5 (31)
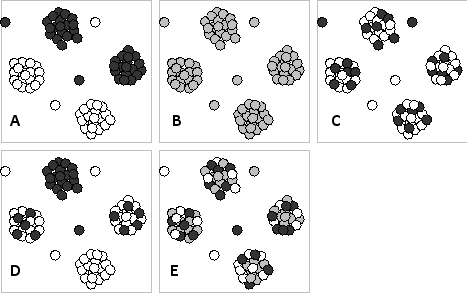
You grow a tumor-derived cell line in a suspension culture, in which the cells are seen either as single cells or in cell clusters. The cells have been engineered to express green fluorescent protein (GFP) under the control of the mitogen-activated protein kinase (MAP kinase) pathway. To your culture media, you add different concentrations of fibroblast growth factor (FGF)-which is known to activate the MAP kinase pathway in these cells-and briefly incubate the cells before harvesting them. You also collect, under a microscope, hundreds of individual cell clusters from each suspension. You then disaggregate the cells in all of your samples and use a FACS (fluorescence-activated cell sorting) machine to measure the GFP signal intensity in individual cells. Finally, you plot the results as histograms, as shown below. 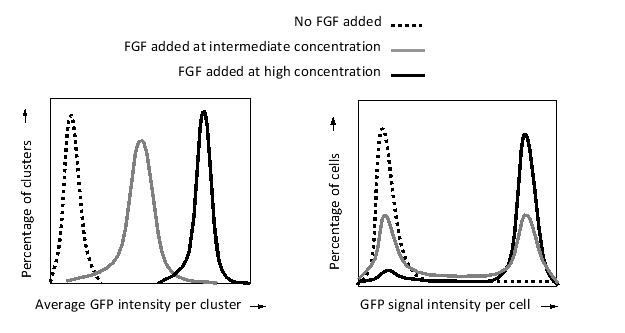 According to these results, which of the following schematic drawings better represents the expression of GFP (a proxy for MAP kinase activation) in the culture after intermediate FGF stimulation? In these drawings, higher GFP expression is represented by a darker shade.
(Short Answer)
4.8/5 (28)
Indicate true (T) and false (F) statements below regarding the ubiquitin ligase c-Cbl. Your answer would be a four-letter string composed of letters T and F only, e.g. TTTF.
( ) It contains an SH2 domain, and can therefore activate RTK signaling.
( ) It ubiquitylates activated RTKs.
( ) Its overactivation can lead to prolonged RTK signaling and promote the development of cancer.
( ) It is part of a negative feedback loop to down-regulate RTKs.
(Short Answer)
4.7/5 (34)
Indicate whether each of the following occurs inside the cell in the presence (P) or absence (A) of stimulation with a Hedgehog signal. Your answer would be a four-letter string composed of letters P and A only, e.g. PPPP.
( ) Sequestration of Smoothened in intracellular vesicles
( ) Accumulation of unprocessed Ci in the nucleus
( ) Phosphorylation of Smoothened
( ) Recruitment of Fused and Costal2 to the plasma membrane
(Short Answer)
4.9/5 (34)
Consider the signaling pathway depicted below, which involves two different receptors. Assume that a protein is active only when it is activated but not inhibited by its upstream signaling molecules. Activation and inhibition are indicated by normal and blunt arrows, respectively. Under which of the following conditions is target-gene expression induced? 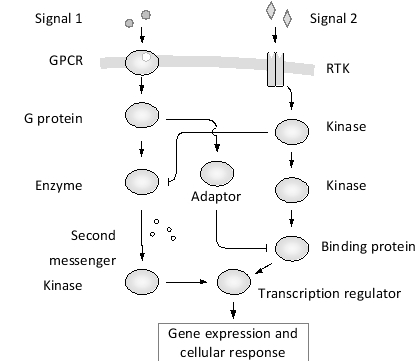
(Multiple Choice)
5.0/5 (31)
Cancer-related genes can be classified into two major groups. Proto-oncogenes encode proteins that normally act in promoting cell growth and proliferation. Gain-of-function mutations in proto-oncogenes can therefore transform the cells into a cancerous state. Tumor suppressor genes, on the other hand, encode proteins that normally function to keep cell proliferation in check. Thus, loss-of-function mutations in tumor suppressors can lead to cancer by eliminating the inhibitory effect of these genes. Mutations in genes encoding the components of the canonical Wnt signaling pathway are commonly found in colorectal tumors. Indicate whether the gene for each of the following is a proto-oncogene (P) or tumor suppressor (T). Your answer would be a four-letter string composed of letters P and T only, e.g. PPPP.
( ) Wnt
( ) APC
( ) Axin
( ) ?-Catenin
(Short Answer)
4.7/5 (38)
Whereas the cholera toxin ADP-ribosylates the α subunit of stimulatory G protein (Gs), thereby blocking GTP hydrolysis, pertussis toxin ADP-ribosylates the α subunit of inhibitory G protein (Gᵢ) and prevents interaction with the receptor. What is the effect of these toxins on the concentration of intracellular cAMP?
(Multiple Choice)
4.8/5 (31)
What is the major way by which the monomeric G protein Ras is activated in receptor tyrosine kinase signaling?
(Multiple Choice)
4.8/5 (35)
In the following diagram showing five parallel signaling pathways downstream of a receptor tyrosine kinase (RTK) and a G-protein-coupled receptor (GPCR), indicate which boxes (A to E) correspond to the following proteins. Your answer would be a five-letter string composed of letters A to E only, e.g. CDBAE.
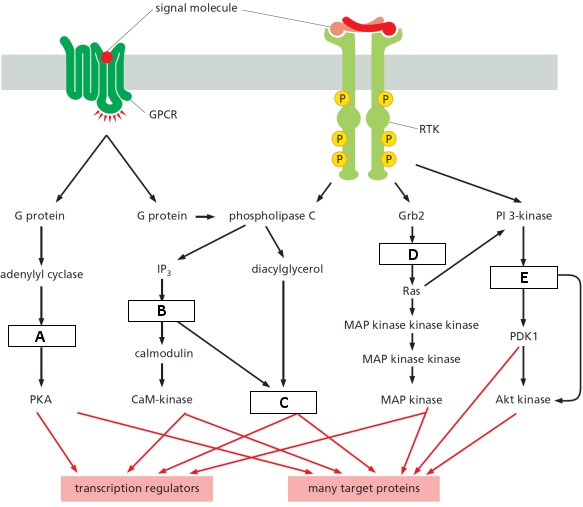 ( ) Cyclic AMP
( ) Protein kinase C
( ) Sos
( ) PI(3,4,5)P3
( ) Ca2+
( ) Cyclic AMP
( ) Protein kinase C
( ) Sos
( ) PI(3,4,5)P3
( ) Ca2+
(Short Answer)
4.8/5 (39)
Indicate true (T) and false (F) statements below regarding cellular signaling mediated by nitric oxide (NO). Your answer would be a four-letter string composed of letters T and F only, e.g. TTTF.
( ) Once produced, NO can diffuse to neighboring cells.
( ) NO has known roles in cGMP-independent as well as cGMP-dependent signaling.
( ) NO normally decreases cGMP concentration by activating cGMP phosphodiesterase.
( ) The drug Viagra® counteracts the effects of NO on penile blood vessels.
(Short Answer)
4.8/5 (21)
The Src kinase can be regulated by at least two mechanisms. Kinases of the CSK family inactivate Src by phosphorylating a C-terminal tyrosine residue. On the other hand, binding of activating ligands (including some activated receptor tyrosine kinases, or RTKs) results in autophosphorylation at a tyrosine residue near the active site, stimulating Src activity. Full activation of Src therefore requires both dephosphorylation at the inhibitory tyrosine and binding to an RTK. Which of the following logic gates (A to E) correctly models the activation of Src kinase (output) as a function of the activity of the upstream regulators (inputs)? 
(Short Answer)
4.8/5 (31)
Filters
- Essay(0)
- Multiple Choice(0)
- Short Answer(0)
- True False(0)
- Matching(0)