Exam 10: Graphing Equations and Inequalities
Exam 1: The Whole Numbers360 Questions
Exam 2: Multiplying and Dividing Fractions234 Questions
Exam 3: Adding and Subtracting Fractions157 Questions
Exam 4: Decimals271 Questions
Exam 5: Ratio, Proportion, and Percent297 Questions
Exam 6: Geometry280 Questions
Exam 7: Statistics and Probability133 Questions
Exam 8: Real Numbers and Introduction to Algebra483 Questions
Exam 9: Equations, Inequalities, and Problem Solving224 Questions
Exam 10: Graphing Equations and Inequalities312 Questions
Exam 11: Systems of Equations111 Questions
Exam 12: Exponents and Polynomials386 Questions
Exam 13: Factoring Polynomials233 Questions
Exam 14: Rational Expressions249 Questions
Exam 15: Roots and Radicals220 Questions
Exam 16: Quadratic Equations and Nonlinear Graphs198 Questions
Exam 17: Algebraic Equations and Inequalities199 Questions
Select questions type
Use the slope-intercept form to graph the equation.
-2x + 3y = 6 
(Multiple Choice)
4.8/5  (39)
(39)
Decide whether a line with the given slope is upward sloping, downward sloping, horizontal or vertical.
-
(Multiple Choice)
4.8/5 (28)
Write a direct variation equation, y = kx, that satisfies the ordered pairs in the table.
- 0 -4 -14 0 2 7
(Multiple Choice)
4.8/5 (39)
Write the equation of the line with the given slope, m, and y-intercept, (0, b).
-m = 9; b = -8
(Multiple Choice)
4.8/5 (33)
Find the slope of the line and write the slope as a rate of change. Don't forget to attach the proper units.
-The graph shows the total cost y (in dollars)of owning and operating a minivan where x is the number of miles driven. 
(Multiple Choice)
4.7/5 (38)
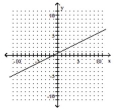
Use two points on the graph to find the slope of the line.
-
(Multiple Choice)
4.8/5 (40)
Graph the linear equation by finding and plotting its intercepts.
-x = -4y 
(Multiple Choice)
4.9/5 (37)
Fill in the blank with one of the words or phrases listed below. y-axis x-axis solution linear standard point-slope x-intercept y -intercept y x slope relation domain range direct inverse slope-intercept function
-A(n)_______equation can be written in the form Ax + By = C.
(Multiple Choice)
4.8/5 (39)
Use two points on the graph to find the slope of the line.
-
(Multiple Choice)
4.9/5 (33)
Graph the linear equation by finding and plotting its intercepts.
-15y - 5x = -10 
(Multiple Choice)
4.8/5 (35)
Solve.
-The table shows the number of cans of soda sold at a campus stand on five days with different high temperatures for the day. Write each paired data as an order pair of the form (temperature, cans). Then create a scatter diagram of the ordered pairs. Cans of Soda Sold Based on Temperature High Temperature (in degrees Fahrenheit) Number of Cans Sold 70 325 75 350 80 440 85 470 90 575
(Essay)
4.8/5 (39)
Solve. Assume the exercise describes a linear relationship. When writing a linear equation, write the equation in
slope-intercept form.
-In 1860 the population of a midwest city was 20,000. By 1890 it had grown to 24,000. If it continues to grow at the same rate, what will the population be in 1916? Give your answer to the nearest whole number.
(Multiple Choice)
4.8/5 (42)
Complete the ordered pairs for the given linear equation. Then plot the points and graph the equation by connecting the
points.
-
(Multiple Choice)
4.9/5 (27)
Complete the table of ordered pairs for the given equation. Then plot the ordered pair solutions.
-3x + 2y = 6 x y 0 0 1 -3
(Multiple Choice)
4.9/5 (31)
Filters
- Essay(0)
- Multiple Choice(0)
- Short Answer(0)
- True False(0)
- Matching(0)